Playing Time (1)

August 19th, 2013

By doing all these non-linearity measurements, I was thinking to a kind of test to check out the reciprocity. What is going to be reported here is not exactly what is meant by the definition of reciprocity, but it has some relation to it.

What is done is the following :

– the sensor is illuminated with a fixed DC-powered LED light source,

– at a camera gain setting equal to 1 (minimum value), the exposure time is adjusted such that the output value is about 75 % of saturation. Under the conditions present, the exposure time turned out to be 42.24 ms,

– the output signal of the sensor as well as its offset value were measured by means of calculating the average values over a 50 x 50 window and using 100 images,

– next the gain of the camera is set to 4 (maximum value), the exposure time is reduced by a factor of 4 to 10.56 ms,

– the output signal of the sensor as well as its offset value were measured again over the same window and again using 100 images,

– the above sequence of switching between minimum gain and maximum gain (with adjusted exposure time) was repeated 10 times.

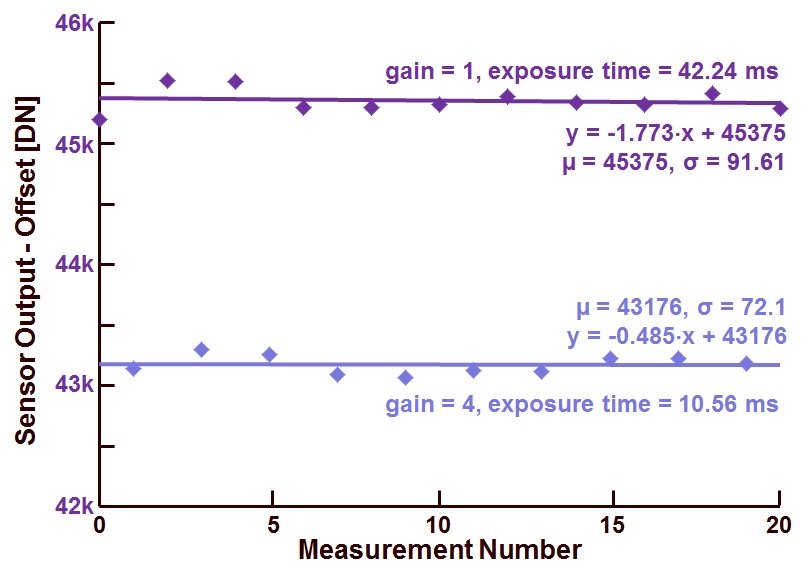
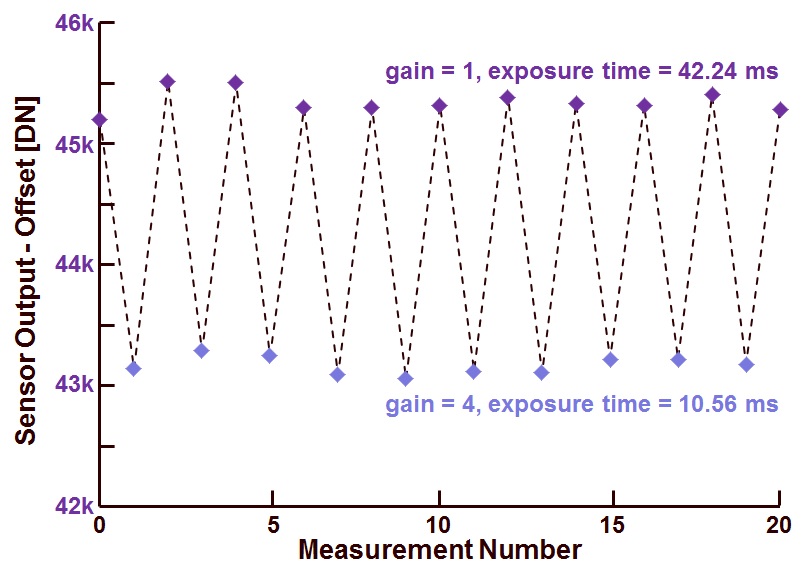
The result of this measurement is shown in Figure 1.

Figure 1 : Sensor output value (corrected for the offset) as a function of measurement number, for each measurement the camera gain and exposure time are matched to each other.

On the horizontal axis the measurement number is shown, on the vertical axis the corrected sensor output is shown. A couple of observations can be made :

– the sensor output values obtained at low gain, high exposure time are not equal to each other. Despite of the large amount of data that is averaged, still quite a bit of noise is present,

– the sensor output values obtained at high gain, low exposure time are neither equal to each other,

– in principle a change in gain would perfectly be compensated by an inverse change of the exposure time, but neither this can be seen in the measurements. From other measurement it could be learned as well that the ratio of sensor output does not exactly matches the ratio of the camera gain settings. So if a gain = 1 corresponds indeed to a gain of 1, the gain = 4 setting does not exactly equals to a gain factor of 4, but comes much closer to 3.81.

The same data as present in figure 1 is repeated in figure 2, but now the regression line is calculated for the two sets of data (low gain and high gain).

Figure 2 : Same data as present in figure 1, but now with the regression lines added.

An more-than-interesting remark can be made now that the regression lines are added : there seems to be a pattern present between the deviation of the measured data and the regression line. Any idea where this effect is coming from ?  You get a bottle of good French wine for the correct explanation !

Albert, 20-08-2013.
Registration for the Imaging Forum ADC’s for Imagers

July 26th, 2013

The registration for the forum is going very fast.  The first session scheduled for Dec. 16 & 17, 2013 is fully booked by now.  All new registrations for the forum that come in are automatically linked to the second session of the forum scheduled for Dec. 19 & 20, 2013.  As mentioned earlier, the second session will follow the same agenda as the first one.  Location as well as speaker will also be the same.  For those of you still interested in the forum, please notice that at this moment, a third session is not scheduled.

Albert, 26/7/2013.

First IMAGING FORUM, Dec. 16th-17th, 2013.

July 22nd, 2013

A few months ago I announced the first imaging forum that will focus on “ADCs for Image Sensors.”  In the meantime the agenda is fixed, and registration for the forum is open.

Because of the great response after the first announcement, a second session of the forum is scheduled to take place on Dec. 19th-20th, 2013.  Same location, same agenda, same speaker.

The agenda as well as the registration information can be found at : www.harvestimaging.com/forum.php

Albert, 22-07-2013.

How to Measure Non-Linearity ? (6)

July 3rd, 2013

In this blog a new measurement is performed : checking the linearity as a function of the gain of the camera.  In principle the illumination is not changed, neither is any other setting, except the gain of the camera.  A (small) non-linearity of the gain setting is not necessarily an issue, for sure not in consumer applications.  But in the case the camera is going to be used for measurement purposes, then a non-linearity in the gain setting can result in an error of the measurements.

The same measurement method is used as before, adapted for the gain analysis :

–       Grabbing 100 images at various gain settings with a constant light input and constant exposure time (10 ms).  The gain of the camera is changed in small steps between a minimum gain = 1 and a maximum gain =4, the increments of the gain are 0.125 (these numbers are defined by the camera software),

–       As a function of the gain, the average output signal of the camera is calculated for a region-of-interest of 50 x 50 pixels in the center of the imager (taking into account all images grabbed),

–       Next the regression line is calculated,

–       The deviation of the actual output values with the regression line is calculated, and normalized (as a fraction of the saturation level).  The latter gives the integral non-linearity or INL.

Figure 1 shows the obtained results : the measurements are done with 10 ms exposure time.  The dark purple line represents the average output signal of the ROI, the gray line represents the regression line through the measurement points and the light blue solid curve indicates the deviation between the ideal straight behavior and the measured data.  This deviation or INL is normalized to the saturation level of the sensor.

Figure 1 : Integral Non-Linearity (INL) check as a function of the camera gain (color coding of the lines : see text).

A few interesting remarks can be made :

–       The behaviour of the sensor/camera as a function of the gain setting seems to be pretty linear, based on its measured output curve,

–       But when taking a closer look to the numbers, the difference between the gray regression line and the purple sensor output curve is relatively large.  It should be mentioned that a deviation or INL of 1.5 % (of the saturation level) is equal to 15 LSB’s or grey levels for a 10-bits ADC resolution.

As mentioned in the introduction, at a fixed camera gain, this non-linearity is not an issue at all.  It only becomes important if the sensor/camera is used at different gain settings and the obtained results are compared.  In that case a non-linearity in gain can cause problems.

Albert, 03-07-2013.


IISW 2013 (4)

June 21st, 2013

Final day of the workshop with only sessions in the morning.  After such a huge amount of information, just half-a-day of sessions is more than welcome !

The first session in the morning focussed on global shutter devices, apparently a very hot topic in the CMOS imaging world.  Global shutters can be made in the charge domain or in the voltage domain.  Both were presented at the workshop.  Charge domain shutters implement several techniques known from the CCD world.  Examples were shown by Aptina (in-pixel pinned storage node) and by Luxima (floating storage gate).  A voltage domain shutter was shown by CMOSIS (8T pixel in a shared configuration).  Forza (5T pixel) and GrassValley (5T pixel) illustrated the well-known global-shutter technique based on a 4T pinned photodiode, with a parallel second reset transistor responsable for shuttering and anti-blooming.  Interesting statement from GrassValley : “The noise level in broadcast imagers/sensors is improving at a pace of 1dB/year”.

Final session showed progress in oversampled imaging systems and HDR.  Nokia tried to convince the audience about oversampling by having more pixels (41.5 Mpix, 1.4 um pitch) even in a mobile phone.  Oversampling can also be applied in the time domain to create HDR, also an already known technology.  Omnivision showed an oversampling system in the spatial domain (with a high sensitivity diode in combination with a low sensitivity diode) implemented in CMOS.  A similar CCD device was (maybe still is) applied by Fujifilm.  Apparently the ideas earlier implemented in CCD technology find a new life in the CMOS world.  Why not ?

Sunday noon time, the workshop came to an end.  Again another high-quality one !  The next one will take place in 2015, somewhere in Europe.  Looking forward to see all these imaging friends (at the workshop even your competitors become your friends) in 2 years from now.

Albert, 21 June 2013.


IISW 2013 (3)

June 19th, 2013

Sorry I could not report earlier, but my set of proceedings with hand-written notes is still in my lugage, which is lost by this wonderful airline, called DELTA ….

What I do remember of the third day (based on looking through the program), it was again a long day with a superb end :

– there are still a few “pure CCD” developments announced, but the trend year after year is to see and get less and less “pure CCD” improvements.  CCD research in a 100 % CCD process is really becoming an exception.  CCD advances were announced by TeledyneDALSA and LBNL Berkeley,

– in contradiction to the previous statement, there were 3 “embedded CCDs in CMOS” reported by the following companies/institutes ” imec, TowerJazz (in cooperation with STFC Rutherford) and Espros, so is a pure CMOS device becoming a dinosaur as well ?

– first technical results and progress was reported about the quanta imager researched at Dartmouth and at Rambus.  If I remember well, the first time the quanta device (at that time still called jot) was announced was at IISW2005,

– further improvements on organic CMOS was shown by Fujifilm in cooperation with Panasonic,

– also remarkable was the announcement of a research cooperation between Panasonic and imec, illustrated by a 4k2k 60-fps imager with a stagger-laced dual-exposure technique,

– two large areas devices were presented that can be found back in today’s DSLR products : one by Aptina (10.8 Mpixels, 1-inch format) and one by CMOSIS (24 Mpixel, 36 mm x 24 mm),

– during the ToF session, major attention was paid on the issue of cancelling the background illumination,

– hard to imagine, but the magic barrier of 1 Gfps seems to come closer and closer : two solutions were introduced, one in CMOS technology, the other one in a combined CCD-CMOS technology.

At the end of day 3, we had an invited talk by Mike Tompsett, for me (and many more) one of the highlights of the workshop 2013.  Mike explained the hieararchical structure at Bell Labs at the time of the invention of the CCD, and it turned out that in 2009, OR the right people got the Noble Prize for the wrong invention, OR the wrong people got the Noble Prize for the right invention.  The Noble Prize Committee gave out the Noble Prize for the Invention of the CCD Image Sensor.  But the one who owns the patent with the same title is Mike Tompsett, and not his manager of his upper-management.  In his explanation about the history of the invention of the CCD imager, Mike also included the important contribution of Gene Weckler and Peter Noble.  Without their pioneering work in imaging there would never had been a CCD image sensor.  A very impressive talk by the  inventor of the CCD image sensor.  BTW Mike authographed my copy of his book “Charge Transfer Devices”, which I bought in 1979.

On Saturday night we had the traditional banquet with announcements and awards.  The first (IISS) Exceptional Lifetime Achievement Award was handed out to Gene Weckler.  Gene, almost 81 years old (or young ?), gave an overview of his imaging carreer.  He started somewhere in the ’60s with imaging, and ended in 2009, including the start-up of two companies.  Gene is one of these giant, on whose shoulders we all are standing now.

Albert, 19 June 2013.


IISW 2013 (2)

June 15th, 2013

Day 2 started with several presentations on Avalanche Photodiodes and SPADs.  Like other technologies and other applications, also the SPADs have come a long way in technology and in complexity.  It seems that the “killer application” for the SPADs is lying in the medical world.  But nevertheless others are mentioned as well, even the usage of a SPAD in a joystick and as a random number generator.

After the SPAD session, the machine gun was loaded and fired again : 26 flash presentations of 3 minutes, being the appetizer to make the audience curious for the posters.  It is amazing to see how over the years the audience and the presenters got used to the flash presentations.  Almost nobody went over the time limit.

Later on the day the poster viewing session offered the opportunity to a closer interaction with the presentors.  Many people attended the poster viewing, actually not surprising, because having 46 posters out offers enough information to make sure that one always can find some subject of interest.  Also for the poster session it is way too difficult to describe the technical content.  The subjects ranged from very detailed device physics (pinning voltage, saturation levels, feed-forward voltages, …), over image sensor architectures (TDI clocking in CMOS, gratings in a stacked imager, …), to circuitry (several ADC architectures, …) to subjects on system level (specs for security cameras, …).  All posters were hanging on the poster boards, except one.  For the first time we had a walking poster : the author prepared his poster on two boards, one hanging on his chest, one hanging on his back, like a walking advertising man.  Instead of having the audience to choose the poster they would like to see, the walking poster man went to the people he thought that might be interested in his poster.  Or maybe he went to the people of which he thought they had to see his poster !  Good marketing, good idea, thanks Bart.

Albert, 15 June 2013.

IISW 2013 (1)

June 14th, 2013

Yesterday the International Image Sensor Workshop kicked off in Snowbird, Utah, USA.  150 happy faces in the early morning, 150 tired faces in the evening.  The amount of information presented on the first day was already enormous !  Besides the several presentations (of max. 15 min) we also got the first 20 flash presentations (3 min) that accompany the poster session.  It is really impossible to give an overview of all papers in this blog.

The content of the presentation on the first day showed a lot of variety : from reverse engineering, over fabrication technology, to noise analysis, and implementation of new architectures.  In general the papers are of very high quality (we do not expect anything else from this workshop !).

The first paper in the workshop was one from Chipworks, showing us some interesting reversed-engieered details of the imagers that normally are not being disclosed by the manufacturers.  Estonishing how the sensors becoming masterpieces of 3D integration if one simply looks to the optical parts on top of the pixels.

Pixels are going towards the next generation, below 1 um.  The amount of effort, the amount of innovation that goes into these developments can only be underestimated.  A couple of papers highlighted a few details of how to lower the optical stack, how to lower the optical cross talk, how to increase the full well capacity.  Actually if it comes down to specifications, the history is simply repeating itself already since decades : lower noise, higher sensitivity, etc.  But the “tricks” applied to maintain or improve the performance constantly change of course.

Interesting, but also new to the workshop (we did not had these papers for several years), were several papers on technology, including the developments of different lithographic tools dedicated for image sensors and BSI, gettering methods, molecular beam epitaxy, fully organic imagers which are flexible, etc.  A complete session was devoted to noise.  Including modelling of the noise, reduction of the noise by means of process adaptation and optimization, and engineering white blemishes.

Albert, 14-06-2013.

He did it again !

June 9th, 2013

Yesterday night, June 8th, he played with his band for a full house in Brussels.  The last sentence of the last verse of the last song of of his regular set was : “There’s more to the picture than meets the eye”.  We all know that this is more than true.  Thanks Neil for reminding us 😉

How to Measure Non-Linearity ? (5)

June 7th, 2013

After the discussion of the non-linearity of large signals, this blog will focus on the linearity of small signals. Some new stuff can be learned !

To characterize the integral non-linearity of small signals, the following procedure is followed :

– Grabbing images at various exposure times with a constant light input. The exposure time is changed in small steps for very small signals (between 0 % and 15 % of saturation) and for very large signals (between 85 % and 100 % of saturation),

– The regression line is calculated for the output values ranging between 10 % and 90 % of saturation,

– The deviation of the actual output values with the regression line is calculated, and normalized (as a fraction of the saturation level). The latter gives the integral non-linearity or INL,

– Focus is paid on the smallest output values and the largest output values.

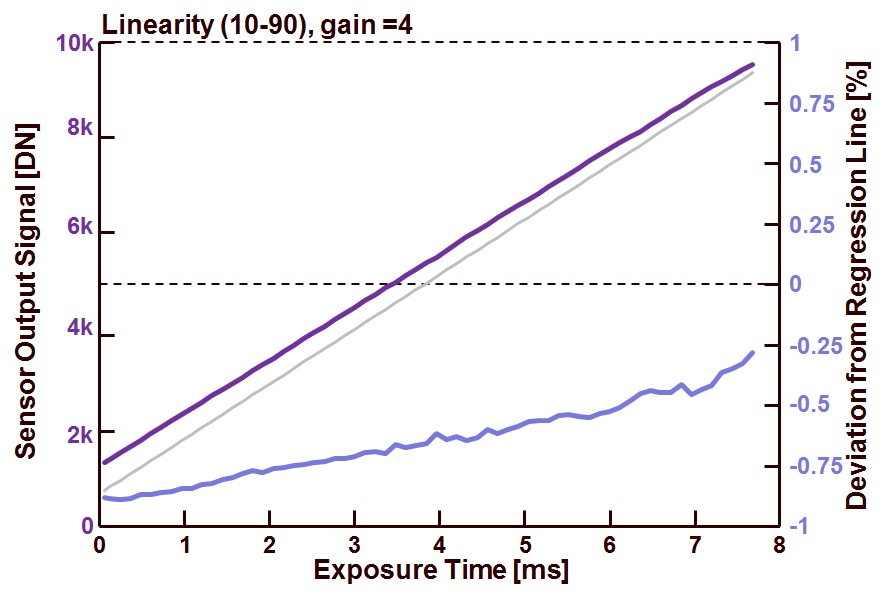
Figure 1 shows the obtained results : the measurements are done with a camera gain = 4. The dark purple line represents the average output signal of a ROI of 50 x 50 pixels, the gray line represents the regression line through the measurement point and the light blue solid curve indicates the deviation between the ideal straight behavior and the measured data. This deviation or INL is normalized to the saturation level of the sensor.

Figure 1 : Integral Non-Linearity (INL) check (color coding of the lines : see text).

The two green rectangles in Figure 1 indicate two areas that are magnified in the next two figures.

Figure 2 shows the results for the output values of the sensor ranging between 0 % and 10 % of the saturation level.

Figure 2 : Linearity check for output values between 0% and 10 % of the saturation level (color coding of the lines : see text).

A few interesting remarks can be made :

– The output of the sensor seems to be pretty linear, but when closely looking to the numbers, the difference between the gray regression line and the purple sensor output curve is relatively large. It should be mentioned that a deviation or INL of 1 % (of the saturation level) for these small signals can be very large in absolute values compared to the actual ouput value,

– The INL is becoming worse if the signal is getting smaller,

– The offset calculated by the regression line can quite largely deviate from the actual offset,

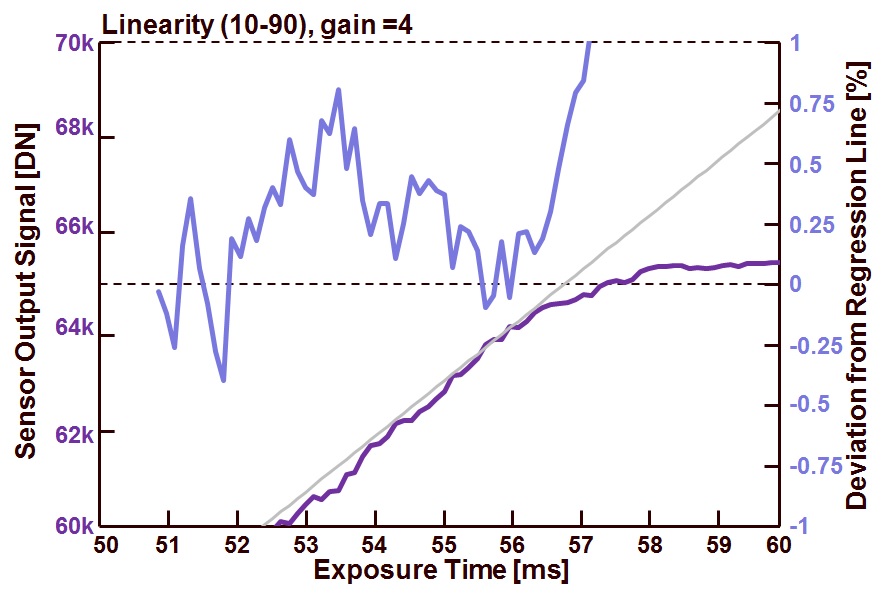
Based on the data presented in Figure 1, one could conclude that the INL for small signals is not that bad, but if the data is put underneath a “magnification glass”, the story becomes different ! Figure 3 shows the results for the output values of the sensor ranging between 90 % and 100 % of the saturation level.

Figure 3 : Linearity check for output values between 90% and 100 % of the saturation leve (color coding of the lines : see text).

Also for this case, a few interesting remarks can be made :

– The regression line is based on the data points between 10 % and 90 % of the saturation level, so any saturation of the pixels is not taken into account to create the regression line. While it is clearly visible that the pixels do saturate, it is not a surprise that the INL is growing once the pixel start to go into saturation,

– The INL remains pretty low till the first pixels of the ROI start saturating, then the saturation takes place very rapidly (between 56 ms and 58 ms). This fast transition from linear region into saturation can be explained by the fact that not the pixels saturate, but the ADC runs into saturation,

– The ouput signal of the sensor seems to be very noisy, this effect is the result of the limited number of images (=50) that is being used to calculate the sensor’s output value. Close to saturation the pixels have stored a lot of photon-generated electrons, so the photon-shot noise on these signals is relatively large.

Amazing that such a simple measurement as the evaluation of the linearity reveals very important and very interesting details ! Next time ? Not known yet what will come next …

Albert, 07-06-2013.