The next parameter to be characterized is the full well capacity of the sensor. But before any measurement or characterization can be done it is important to make clear what is the definition of the full well capacity (FWC). To come to that point, let’s treat two different situations, the first one in which the ADC is setting the saturation of the sensor and the second one in which the ADC is not setting the saturation of the sensor.
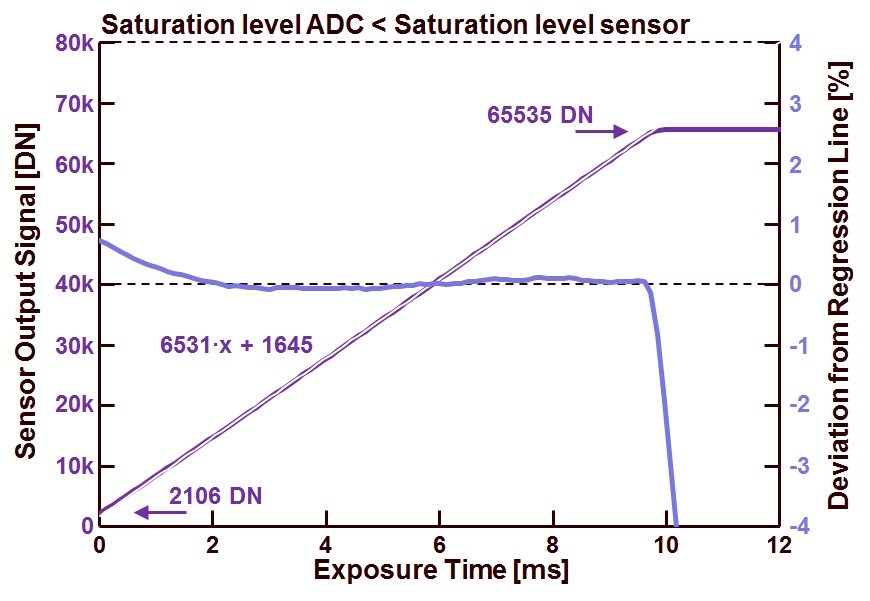
1) Saturation of the sensor is larger than maximum value of the ADC. In such a case, most of time the camera/sensor designer is setting the maximum value of the ADC such that the complete ADC range covers the linear part of the sensor’s output response. An example of a camera in which the ADC defines the maximum output level of the system is shown in Figure 1.
Figure 1 : Sensor output value as a function of exposure time, under a constant illumination level.
Shown is the sensor output as a function of the exposure time with a constant illumination level (at this stage of the discussion, the exact value of the light input is not important for this measurement, as long as it stays constant, so that various setting of the camera and/or sensor can be compared with each other). On the right axis the integral non-linearity is shown as well. As can be observed, the transition from a monotonically increasing output value to saturation goes pretty abruptly. This is a clear indication that the ADC defines the saturation level. Moreover, the value of the saturated output is equal to 216 – 1 = 65535 DN (216 is coming from the TIFF format).
For this example, the definition of the full well capacity is equal to the saturation level (of the ADC) minus the offset at zero seconds exposure time, or 65535 – 2106 = 63429 DN. Taking into account the conversion gain of the sensor (3 DN/electron, for the TIFF format it is 64x larger than what can be measured at the output of the sensor), this results in a FWC = 19820 electrons.
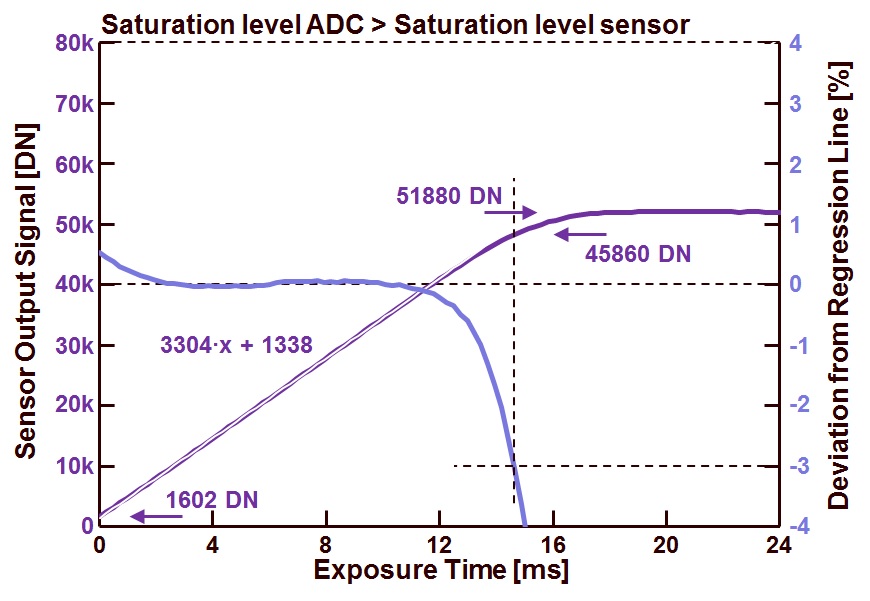
2) Saturation of the sensor is smaller than maximum value of the ADC. In this case, the FWC needs a clear definition : is FWC referring to the saturation level of the sensor/camera, or is FWC referring to the maximum linear part of the sensor’s output swing ? The former can be referred to a FWCsat, while the latter can be indicated by FWClin. But then the question arises : how to define the linear part of the sensor’s output swing ? Very often, FWClin is defined at the point where the deviation of the sensor’s output and an ideal straight line is maximum 3 %, or at the point where the sensor’s output is linear up to 97 % or better. An example of a camera in which the ADC maximum output value is larger than the saturation level of the sensor is shown in Figure 2.
Figure 2 : Sensor output value as a function of exposure time, under a constant illumination level.
Shown on the left vertical axis is the sensor output as a function of the exposure time with a constant illumination level (the exact value of the light input is not important for this measurement, as long as it stays constant), shown on the right vertical axis is the corresponding integral non-linearity (INL). As can be observed, the transition from a monotonically increasing output value to saturation goes smoothly. This is a clear indication that the ADC is NOT defining the saturation level of the system.
For this example, the definition of the full well capacity at saturation is equal to the saturation level minus the offset at zero seconds exposure time, or 51880 – 1602 = 50278 DN. Taking into account the conversion gain of the sensor (1.5 DN/electron), this results in a FWCsat = 33518 electrons.
But as mentioned before, this is only half of the story, because the sensor’s response is very nonlinear close to saturation. For that reason the linearity (INL) of the sensor is characterized and plotted in Figure 2 as well. At the point where the real output characteristic deviates 3 % from its regression line, the FWClin is defined. In this example, the following number can be found : 45860 – 1602 = 44258 DN, translating in FWClin = 29505 electrons.
It should be clear that this last number is very much depending on the definition of FWClin. If the 3 % deviation is shifted to 1 %, the value for the FWClin will become smaller, or if the 3 % deviation is shifted to 5 %, the opposite becomes valid.
Note : the data shown in Figures 1 and 2 are obtained from the same sensor, with the same light input. The difference between the two measurements is a difference in camera setting, such that the analog gain of the sensor and the reference voltage of the ADC result in an overall camera gain difference of a factor of 2.
Explained in this blog is the measurement of FWC based on linearity measurements. Again it can be learned that the values obtained for the FWC strongly depend on the exact definition of the full well capacity. Lesson to take away : if the FWC is specified in an image sensor’s datasheet, first ask yourself “How is the FWC defined ?”.
See you next time !
Albert, 27-09-2013.
