As a logical next step in the “How to Measure” discussion is to look after the non-uniformities with light input on the sensor or Photo-Response Non Uniformity (PRNU). PRNU is the variation of the output signal from pixel to pixel in the case light is falling on the sensor. It should be noted that the average sensor signal itself can be composed out of :
– DC offset, introduced by the electronic circuitry, and which is (in a first instance) independent of temperature and exposure time
– Dark current, depending on temperature and on exposure time,
– Photo response, depending on exposure time.
Just like in the case of the average signal, the non-uniformities are calculated (!) based on several images taken in controlled conditions. To limit the influence of any thermal noise component, several images need to be grabbed, preferably at various exposure or integration times. Basically, the same data or images as used in the case of measuring the average signal with light input can be reused. So after averaging all images taken at a particular exposure time to reduce the thermal noise, calculations can take place on the averaged resulting image. To make sure that the obtained result contains the PRNU and is not too much “contaminated” by the dark current, the amount of light put on the sensor should be large enough to make sure that the photon-generated signal is at least two orders of magnitude larger than the dark-current generated signal.
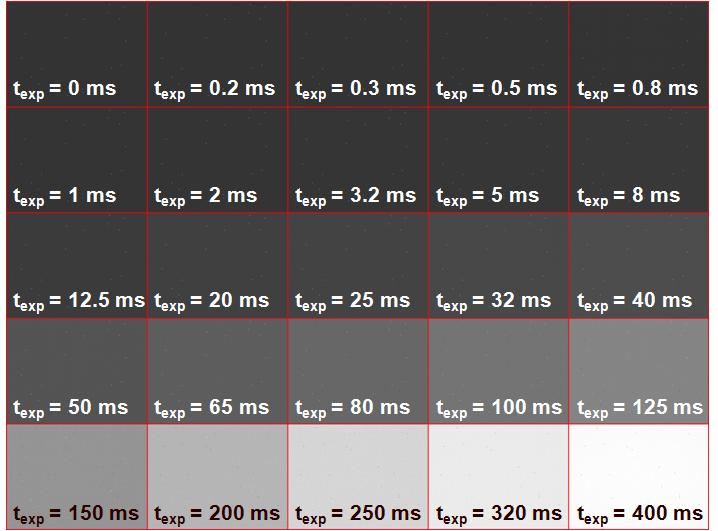
The images used in the calculation of the PRNU are shown in Figure 1 : for 25 different exposure times, the result is visualized in the mosaic image. Corresponding exposure times are indicated.

Figure 1 : Sensor output with light input as a function of the exposure time.
The light input conditions are : 5600K colour temperature and 5 lux light input on the sensor surface. As can be seen from Figure 1, the sensor saturates around 400 ms. This is due to the limitation of the ADC in combination of the gain setting of the camera. These effects will be explained and measured later in another blog.
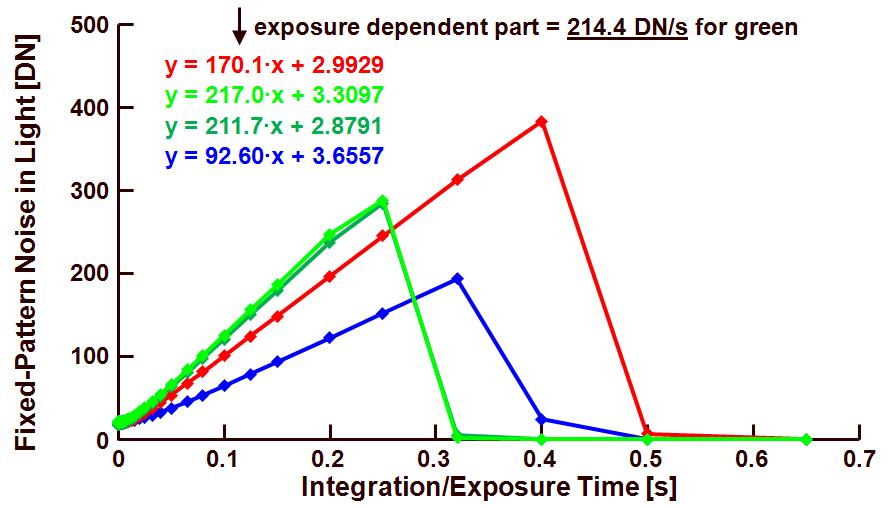
A first way of measuring/calculating the PRNU is to check its behavior as a function of exposure time. The result of this is shown in figure 2.

Figure 2 : fixed-pattern noise with light as a function of the exposure time.
There are four curves shown, one for each colour channel. Please notice that these curves for the PRNU are obtained after correction of the defect pixels !
From the regression line calculated by means of the linear part of the various curves, the following data can be extracted :
– FPN independent of the exposure time, or FPN in dark, being equal to 3.09 DN, (average of the two green channels),
– Time depending part of the FPN, being the PRNU, and equal to 214.4 DN/s, (average of the two green channels).
Taking into account the data obtained (in the previous blog) for the average signal in the various colour channels, the PRNU is equal to :
– Blue channel : 93.6/8770 = 1.06 %,
– Green in the blue line : 211.7/12653 = 1.67 %,
– Green in the red line : 217.0/12715 = 1.72 %,
– Red channel : 170.1/7612.8 = 2.23 %.
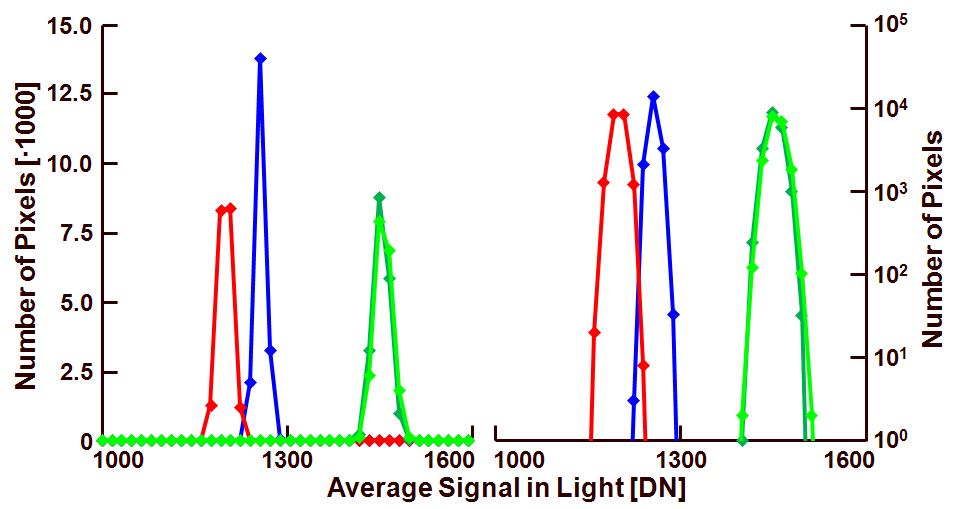
How to express the FPN a sensor or camera ? In contradiction to the DSNU, the PRNU normally is Gaussian distributed (after correction of the defects and shading, see next blog). For that reason it is straight forward to express the PRNU as a percentage of the average signal with light input. This is also done in the above mentioned calculation. To show the Gaussian distribution of the sensor signal with light input, the histogram of the output (at 25 % of saturation) is illustrated in Figure 3. The left group of curves illustrates the histogram with a linear vertical axis, the right group of curves shows the same data but with a logarithmic vertical axis. The latter one is preferred because it shows much better the distribution of deviating pixels (if any) as well.

Figure 3 : histogram of the average signal in dark.
“There is a warning sign on the road ahead” :
Of crucial importance in this measurement is to measure the PRNU and not the non-uniformity of the light source. For that reason special attention is needed to create a uniform illumination. This can be done by :
– Using a point source at a large distance, but in that case the light input will be relatively small,
– Making use of a diffuser in front of the image sensor,
– Imaging a uniform target on the sensor, but in that case the non-uniformity of the lens will be included,
– Using an integrating sphere. This is most probably the easiest solution, although also integrating spheres do not have a uniformity of 100 %.
In the case of a large imaging array, creating a uniform illumination might be complicated. In that case a smaller area of the sensor can be used (in the center of the device) and the PRNU can be characterized across this smaller area. It should be noted that the PRNU values of a smaller area are always more optimistic than the PRNU values of the total sensor area.
Good luck with the PRNU measurements, more to follow next time.
Albert, 14-02-2012.


