In the last blog the MTF measurement based on the slanted edge was introduced. As mentioned in that blog, to understand all ins and outs of the method, it is very beneficial to develop a small, simple model of the sensor with a slanted edge projected on it. And next, analyze the obtained, synthesized image. This simulation tool is also used here to check out the sensitivity of the technique w.r.t. the angle of the slanted edge.
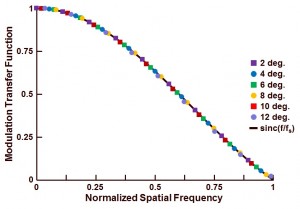
The result is shown in Figure 1.

Figure 1 : Effect of the slanted edge angle on the accuracy of the evaluation technique to characterize the MTF.
Shown are the MTF results obtained for a simulation of the angle being equal to 2 deg., 4 deg., 6 deg., 8 deg., 10 deg. and 12 deg. The ideal curve, obtained by the calculation of the sinc-function, is included as well. As can be seen from the curve :
- All evaluations based on an angle between 2 deg. and 10 deg. seem to fit very well to the ideal curve,
- The simulation result for an angle of 12 deg. shows some minor deviations from the ideal curve.
As a message from this simulation : angles of the slanted edge between 2 deg. and 10 deg. are very well suited for the MTF analysis. Once the angle is larger than 10 deg., the slanted edge method starts loosing its accuracy. The simulation results obtained here are fully in line with the advice of the ISO standard, which suggests also to use an angle of the slanted edge between 2 deg. and 10 deg.
Next time : how to implement oversampling and how to avoid aliasing effects during the measurements.
Albert, 04-07-2014.
