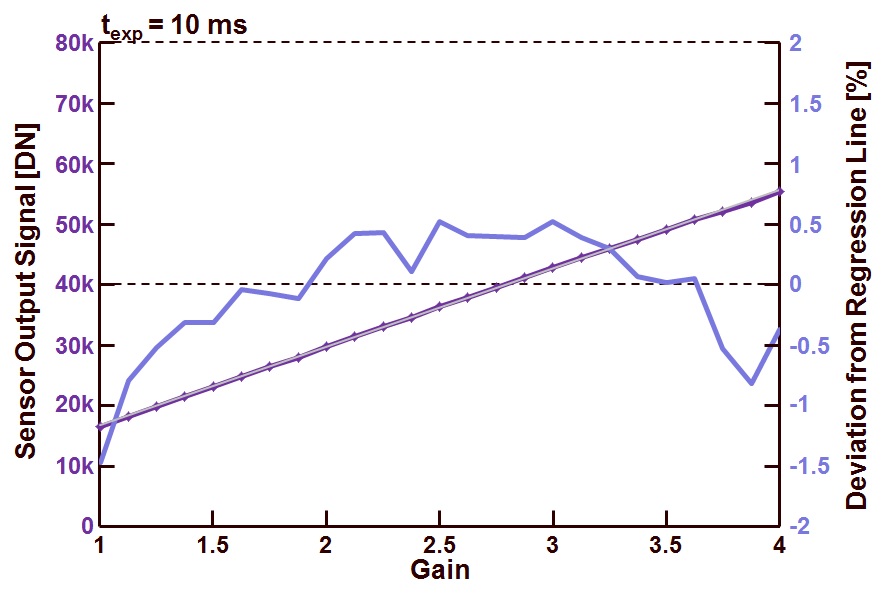
In this blog a new measurement is performed : checking the linearity as a function of the gain of the camera. In principle the illumination is not changed, neither is any other setting, except the gain of the camera. A (small) non-linearity of the gain setting is not necessarily an issue, for sure not in consumer applications. But in the case the camera is going to be used for measurement purposes, then a non-linearity in the gain setting can result in an error of the measurements.
The same measurement method is used as before, adapted for the gain analysis :
– Grabbing 100 images at various gain settings with a constant light input and constant exposure time (10 ms). The gain of the camera is changed in small steps between a minimum gain = 1 and a maximum gain =4, the increments of the gain are 0.125 (these numbers are defined by the camera software),
– As a function of the gain, the average output signal of the camera is calculated for a region-of-interest of 50 x 50 pixels in the center of the imager (taking into account all images grabbed),
– Next the regression line is calculated,
– The deviation of the actual output values with the regression line is calculated, and normalized (as a fraction of the saturation level). The latter gives the integral non-linearity or INL.
Figure 1 shows the obtained results : the measurements are done with 10 ms exposure time. The dark purple line represents the average output signal of the ROI, the gray line represents the regression line through the measurement points and the light blue solid curve indicates the deviation between the ideal straight behavior and the measured data. This deviation or INL is normalized to the saturation level of the sensor.
Figure 1 : Integral Non-Linearity (INL) check as a function of the camera gain (color coding of the lines : see text).
A few interesting remarks can be made :
– The behaviour of the sensor/camera as a function of the gain setting seems to be pretty linear, based on its measured output curve,
– But when taking a closer look to the numbers, the difference between the gray regression line and the purple sensor output curve is relatively large. It should be mentioned that a deviation or INL of 1.5 % (of the saturation level) is equal to 15 LSB’s or grey levels for a 10-bits ADC resolution.
As mentioned in the introduction, at a fixed camera gain, this non-linearity is not an issue at all. It only becomes important if the sensor/camera is used at different gain settings and the obtained results are compared. In that case a non-linearity in gain can cause problems.
Albert, 03-07-2013.

You mean 15 graylevels, not 15 bits. 🙂
Hans, thanks for the remark, I corrected the text accordingly. Albert.