After the discussion of the non-linearity of large signals, this blog will focus on the linearity of small signals. Some new stuff can be learned !
To characterize the integral non-linearity of small signals, the following procedure is followed :
– Grabbing images at various exposure times with a constant light input. The exposure time is changed in small steps for very small signals (between 0 % and 15 % of saturation) and for very large signals (between 85 % and 100 % of saturation),
– The regression line is calculated for the output values ranging between 10 % and 90 % of saturation,
– The deviation of the actual output values with the regression line is calculated, and normalized (as a fraction of the saturation level). The latter gives the integral non-linearity or INL,
– Focus is paid on the smallest output values and the largest output values.
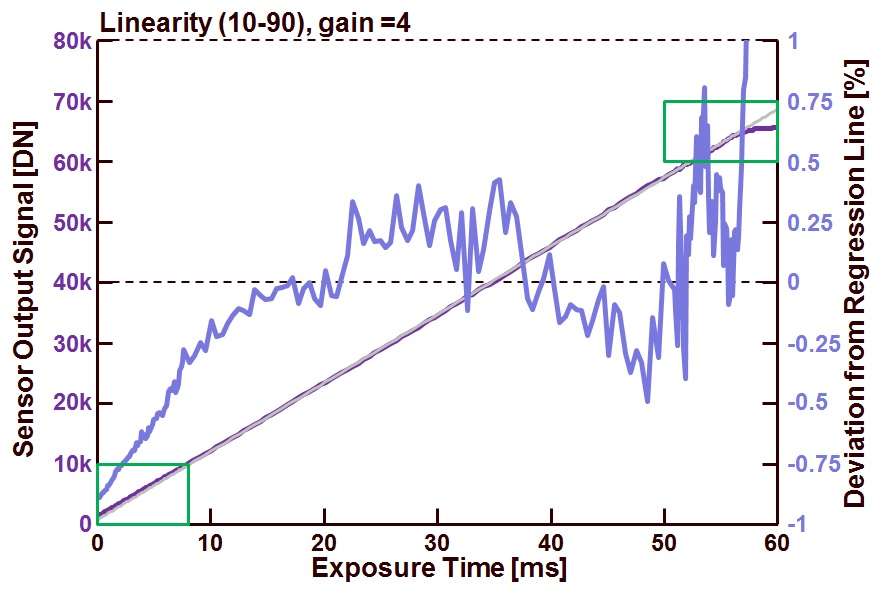
Figure 1 shows the obtained results : the measurements are done with a camera gain = 4. The dark purple line represents the average output signal of a ROI of 50 x 50 pixels, the gray line represents the regression line through the measurement point and the light blue solid curve indicates the deviation between the ideal straight behavior and the measured data. This deviation or INL is normalized to the saturation level of the sensor.
Figure 1 : Integral Non-Linearity (INL) check (color coding of the lines : see text).
The two green rectangles in Figure 1 indicate two areas that are magnified in the next two figures.
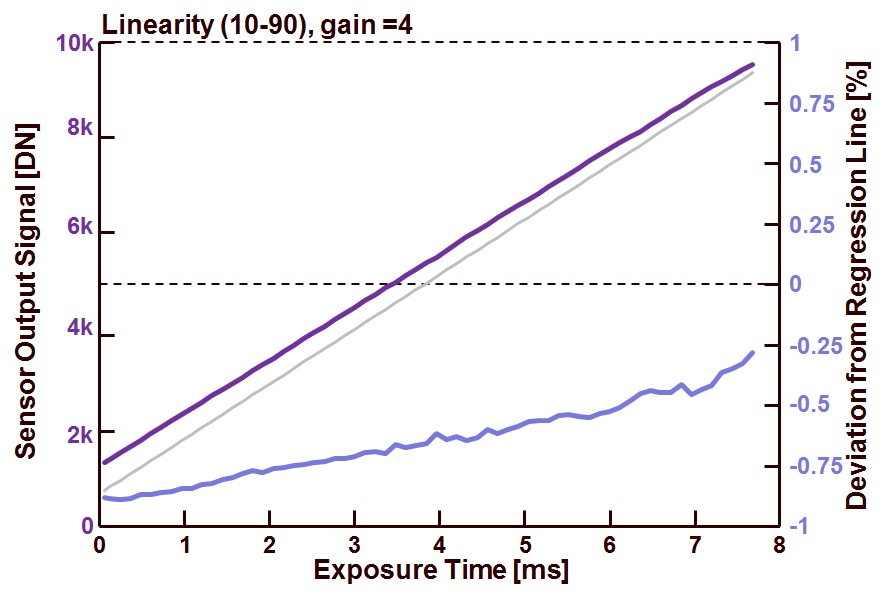
Figure 2 shows the results for the output values of the sensor ranging between 0 % and 10 % of the saturation level.
Figure 2 : Linearity check for output values between 0% and 10 % of the saturation level (color coding of the lines : see text).
A few interesting remarks can be made :
– The output of the sensor seems to be pretty linear, but when closely looking to the numbers, the difference between the gray regression line and the purple sensor output curve is relatively large. It should be mentioned that a deviation or INL of 1 % (of the saturation level) for these small signals can be very large in absolute values compared to the actual ouput value,
– The INL is becoming worse if the signal is getting smaller,
– The offset calculated by the regression line can quite largely deviate from the actual offset,
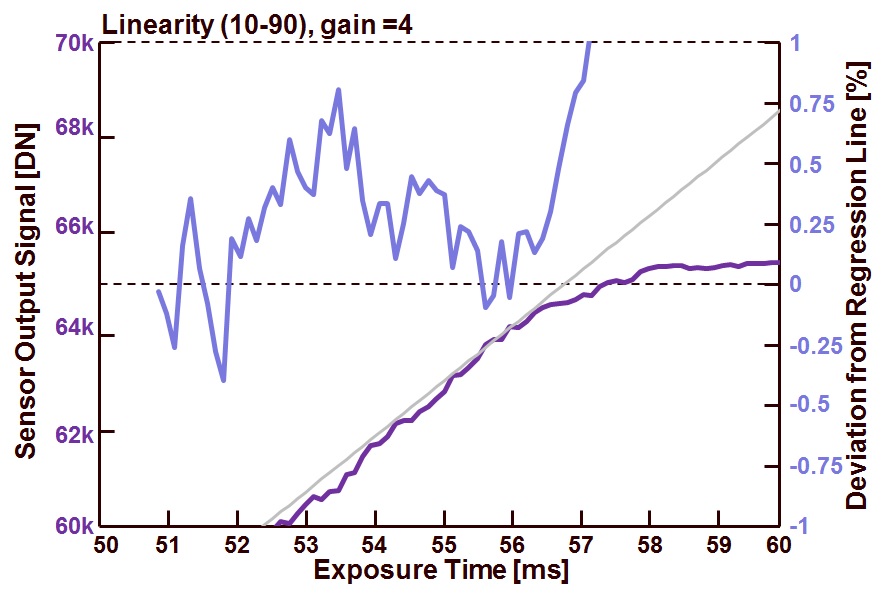
Based on the data presented in Figure 1, one could conclude that the INL for small signals is not that bad, but if the data is put underneath a “magnification glass”, the story becomes different ! Figure 3 shows the results for the output values of the sensor ranging between 90 % and 100 % of the saturation level.
Figure 3 : Linearity check for output values between 90% and 100 % of the saturation leve (color coding of the lines : see text).
Also for this case, a few interesting remarks can be made :
– The regression line is based on the data points between 10 % and 90 % of the saturation level, so any saturation of the pixels is not taken into account to create the regression line. While it is clearly visible that the pixels do saturate, it is not a surprise that the INL is growing once the pixel start to go into saturation,
– The INL remains pretty low till the first pixels of the ROI start saturating, then the saturation takes place very rapidly (between 56 ms and 58 ms). This fast transition from linear region into saturation can be explained by the fact that not the pixels saturate, but the ADC runs into saturation,
– The ouput signal of the sensor seems to be very noisy, this effect is the result of the limited number of images (=50) that is being used to calculate the sensor’s output value. Close to saturation the pixels have stored a lot of photon-generated electrons, so the photon-shot noise on these signals is relatively large.
Amazing that such a simple measurement as the evaluation of the linearity reveals very important and very interesting details ! Next time ? Not known yet what will come next …
Albert, 07-06-2013.


Although cannot see fig 3, so just before saturation?The SNR just increase while non-linearity also increase? or we can say it is not good to compare everyone to saturation level since it is not calculate with weight?
Sorry, but I do not understand what you mean … Albert.