How to Measure Non-Linearity ? (4)

May 17th, 2013

In this relatively short blog, the linearity of the individual pixels will be checked.  Up to now, in the previous blogs, a window of 50 x 50 pixels was taken into account to evaluate the “average” non-linearity of these 2500 pixels.  Because the data of all individual pixels is available as well, it can be a helpful exercise to check the non-linearity of each individual pixel.

The results shown in this discussion refer to the measurements done with a camera gain=1, linearity check between 10% and 90 % of saturation, and with exposure times used up to 60 ms to saturate the sensor (see also previous blogs).

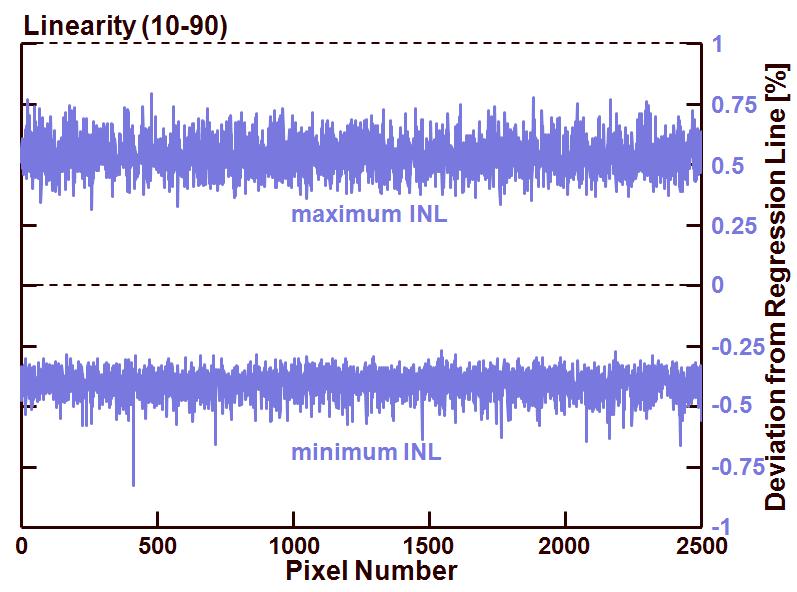
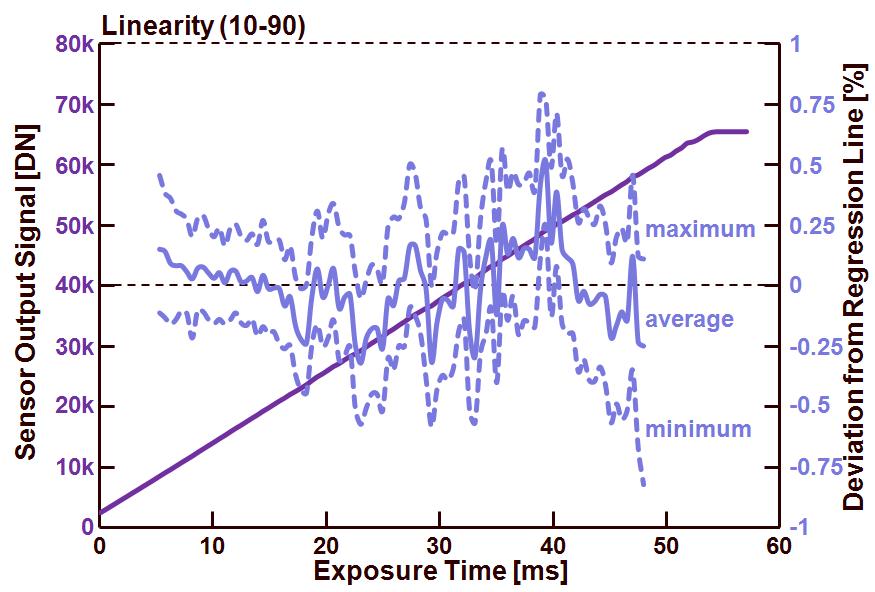
Figure 1 shows the average integral non-linearity (INL) for all the 2500 pixels, as well as the maximum value and the minimum value of the INL that can be found with one of the 2500 pixels (maximum and minimum value do not have to come from the same pixel !).

Figure 1 : Camera output (left axis) and INL (right axis) for an sensor output range between 10 % and 90 % of saturation and a sensor/camera gain setting equal to 1.

As can be seen from the figure, all the worse case INL values of these 2500 pixels nicely follow the trend of the average value.  Another analysis that leads to the same conclusion can be found in figure 2.  Here the maximum and the minimum deviation of each pixel is shown.

 Figure 2 : Maximum and minimum INL value of the 2500 different pixels.

Conclusion : All pixels within the region of interest behave more or less the same as far as INL is concerned.  So it is safe to evaluate the INL by means of the average behaviour of the 2500 pixels belonging to the ROI of interest.

Next time the non-linearity of small signals (between 0 % and 10 % of saturation and between 90 % and 100 % of saturation) will be checked.

Albert, 17-05-2013.

How to Measure Non-Linearity ? (3)

April 22nd, 2013

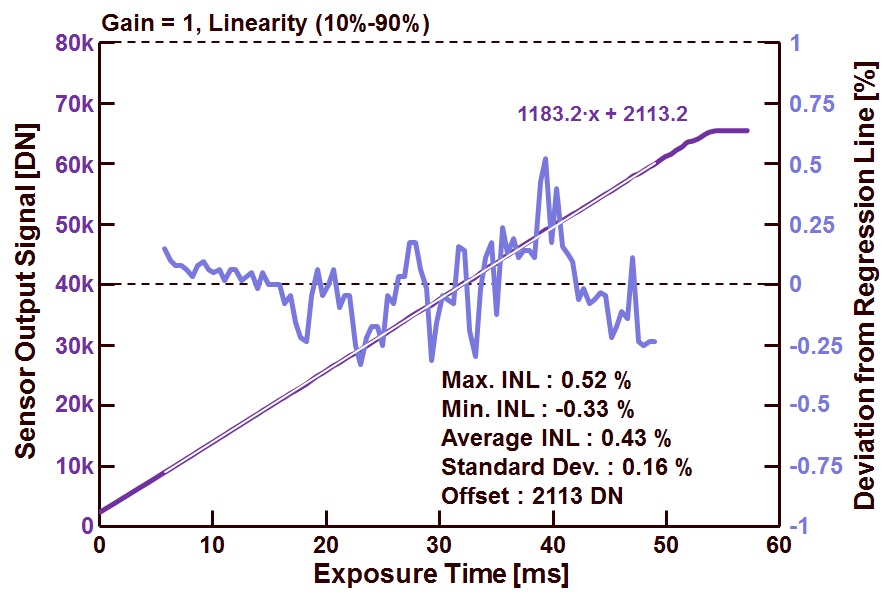
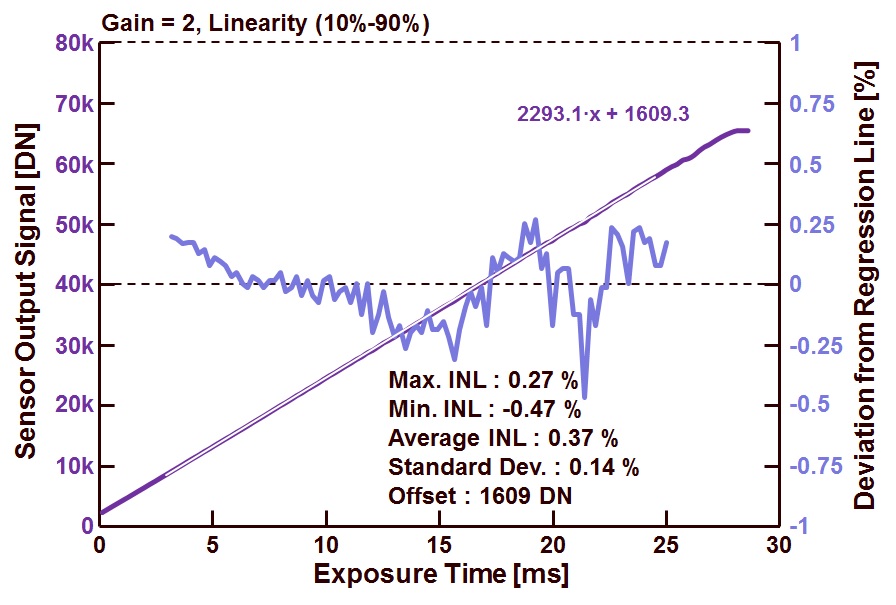
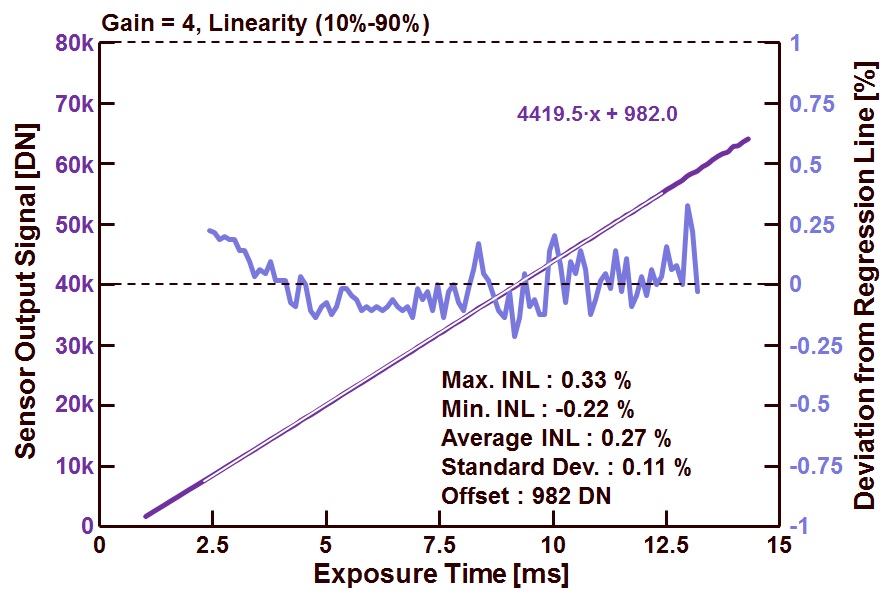
After checking out the linearity of the sensor/camera with a gain set to unity, in this blog the linearity will be checked in the case the sensor/camera gain is set to 2 and 4.  In all three cases (gain = 1, 2 and 4) the linearity will be checked for an output swing of the sensor between 10 % and 90 % of the saturation level.  Figures 1-3 contain the obtained results.


Figure 1 : Camera output and INL for an output range between 10 % and 90 % of saturation and a sensor/camera gain setting equal to 1.


Figure 2 : Camera output and INL for an output range between 10 % and 90 % of saturation and a sensor/camera gain setting equal to 2.


Figure 3 : Camera output and INL for an output range between 10 % and 90 % of saturation and a sensor/camera gain setting equal to 4.


Some remarks :

–       All output signals in all figures have a fairly abrupt transition from their linear behaviour towards saturation.  This is due to the fact that the ADC is defining the maximum output signal and not the pixel or the source-follower.  This was already the case with the measurements presented in the previous blog with gain = 1.  So by increasing the gain of the sensor/camera, this saturation effect does not change,

–       All definitions used in this characterization of the INL are described in the previous blogs,

–       The results reported here come from an group of 50 x 50 pixels, and the graphs show the average non-linearity of these 2500 pixels,

–       The three graphs show (more or less) a similar behaviour of the non-linearity.  It should be noted that not only the gain of the sensor/camera is changed, but also the amount of light is changed by adapting the exposure time.  The light source itself is not changed.  Although the graphs have a different horizontal axis, all three of them :

  • Cover different output swings of the photodiode,
  • Cover different output swings of the floating diffusion,
  • Cover the same output swing of the output amplifier.

With a bit of imagination, one can recognize that the INL shows more or less the same behaviour for all 3 situations and in all cases, and it remains fairly low, even if the gain is increased by a factor of 4.  This observation can lead to the conclusion that the non-linearity measured is not due to the non-linearity in the pixel, but most probably coming from the amplifier located in the (analog) output chain (a so-called V/V non-linearity).

Till now, the INL is characterized within 4 different sections of the output swing (1%-99%, 5%-95%, 10%-90%, 20%-80%) and for 3 different settings of the gain (1, 2 and 4).  All results are summarized in the table below.

Gain

Output swing (%)

Max. INL (%)

Min. INL (%)

Average INL (%)

St.Dev. (%)

Offset (DN)

1 1-99 0.62 -0.74 0.68 0.21 2198
1 5-95 0.57 -0.38 0.47 0.16 2147
1 10-90 0.52 -0.33 0.43 0.16 2113
1 20-90 0.43 -0.35 0.39 0.14 1919

2

1-99

0.33

-0.42

0.38

0.16

1684

2

5-95

0.28

-0.44

0.36

0.16

1650

2

10-90

0.27

-0.47

0.37

0.14

1609

2

20-90

0.31

-0.41

0.36

0.13

1576

4

1-99

0.43

-0.25

0.34

0.16

1029

4

5-95

0.40

-0.25

0.33

0.14

1013

4

10-90

0.33

-0.22

0.27

0.11

982

4

20-90

0.22

-0.19

0.20

0.08

893

All data is coming from the same sensor and from the same group of pixels, but a lot of different numbers can be observed.  So the same conclusion can be made as last time : in the case of INL characterization, it is of crucial importance to specify all parameters and settings of the sensor/camera as well as the conditions for measuring/calculating the integral non-linearity.

What’s up next time ? Then the focus will be put on the INL of the individual pixels.

Albert, 22-04-2013.


How to Measure Non-Linearity ? (2)

April 9th, 2013

Following-up on the previous blog with the definitions of non-linearity, this time the first results will be shown and discussed, focusing on the integral non-linearity or INL of the solid-state camera.

To perform the measurements, the amount of light coming to the sensor is changed by varying the exposure time under constant light conditions (green LEDs).  The amount of light that is coming to the sensor is not measured.  All evaluations are done with a camera without lens, and with a window containing 50 x 50 pixels.  Unless otherwise indicated, all results refer to the average value of these 2500 pixels.

In Figures 1-4, the measurements and calculations are shown which are obtained when the gain of the camera was set to 1.  The difference between the various figures is the sensor output range over which the INL is calculated : Figure 1 from 1 % to 99 % of saturation, Figure 2 from 5 % to 95 % of saturation, Figure 3 from 10 % to 90 % of saturation and Figure 4 from 20 % to 80 % of saturation.  All data about the INL are included in the figures.

Figure 1 : Camera output and INL for an output range between 1 % and 99 % of saturation.

Figure 2 : Camera output and INL for an output range between 5 % and 95 % of saturation.
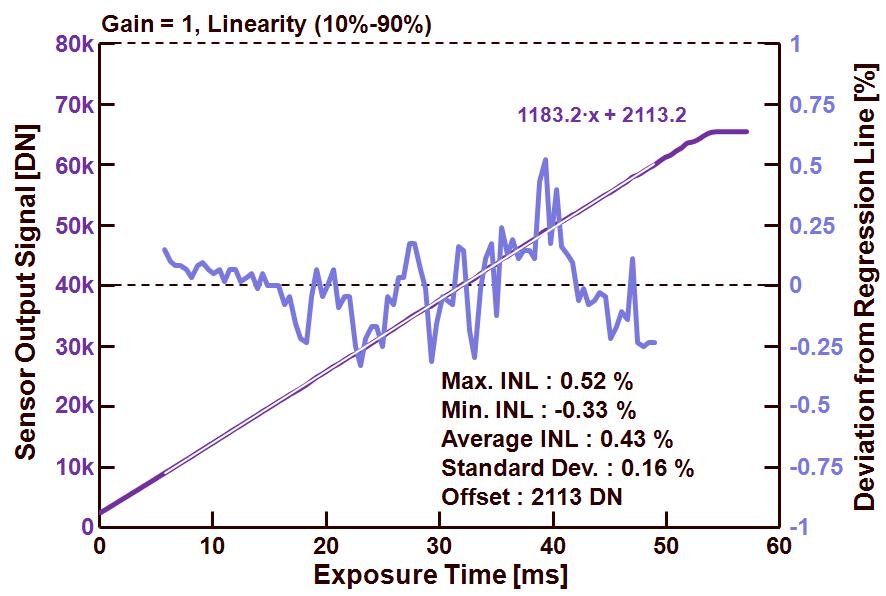
 

Figure 3 : Camera output and INL for an output range between 10 % and 90 % of saturation.
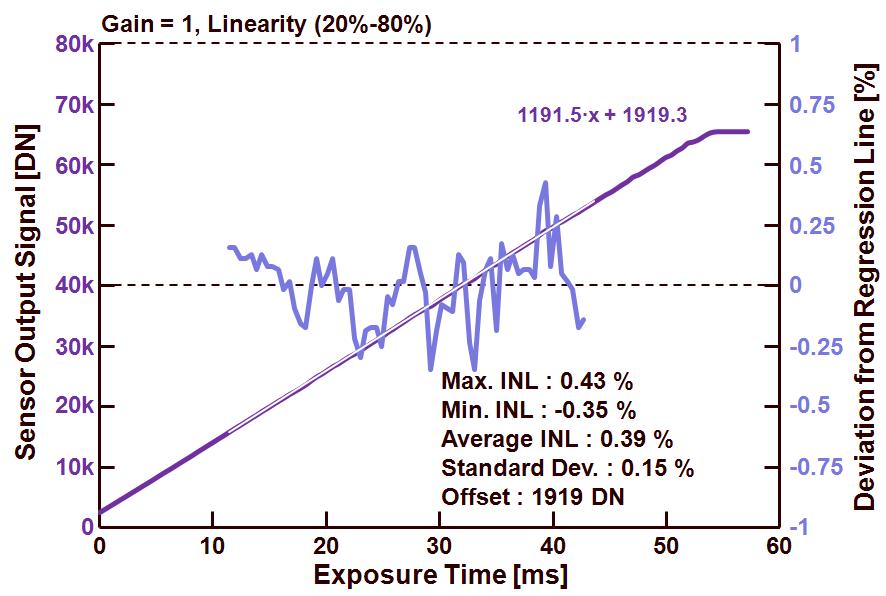
Figure 4 : Camera output and INL for an output range between 20 % and 80 % of saturation.

Some remarks :

–       All output signals in all figures have a fairly abrupt transition from their linear behaviour towards saturation.  This is due to the fact that the ADC is defining the maximum output signal and not the pixel or the source-follower,

–       The output data of the camera is formatted into 16bits TIFF, the sensor has an ADC with 10 bits, and to convert the 10 bits into 16 bits, simply 6 bits are being added to every pixel output,

–       Max. INL indicates the maximum positive deviation of the camera output compared to the regression line drawn through the measurement points, Max. INL is expressed in % of the saturation level (= 216 – offset),

–       Min. INL indicates the maximum negative deviation of the camera output compared to the regression line drawn through the measurement points, Min. INL expressed in % of the saturation level (=216 – offset),

–       Average INL is the mean of the absolute value of the two foregoing parameters, Average INL is expressed in % of the saturation level (=216 – offset),

–       Standard Dev. is the standard deviation of all INL data points, Standard Dev. is expressed in % of the saturation level (=216 – offset),

–       Offset : refers to the offset of the camera output, found by extrapolating the regression line to an exposure time equal to zero seconds,

–       All parameters expressed as a percentage of the saturation level, can also be expressed in LSB, in that case 1 LSB of the sensor corresponds to about 0.1 %.

What can be learned from the four figures is the fact that all INL parameters are becoming better (= smaller) if the output range over which the INL is calculated, is becoming shorter or more limited.  This is not surprising because very often, the largest non-linearities of a sensor can be found in the lower range of its output and the higher range of its output.  This observation could give rise to the idea to limit the output range even further to calculation the INL …  So it should be clear that together with the INL specification, it is necessary to mention over which output range of the sensor/camera the INL is specified.

What’s up next time ? INL in combination with gain setting of the camera.

Albert, 09-04-2013.
 

Announcement of FIRST IMAGING FORUM, Dec. 16th-17th, 2013.

April 4th, 2013

Mark now already your agenda for the very first solid-state imaging forum.  It is scheduled for Dec. 16-17th 2013.  Again another conference ? NO, absolutely not.

The solid-state imaging forum will be a high-level, technical, short course focusing on one particular hot topic in the field of solid-state imaging.  The audience will be strictly limited to 30 people, just to stimulate as much as possible the interaction between the participants and speaker(s).  The subject of the first forum will be : “ADCs for Image Sensors”.  Only world-leading and independent expert(s) will be cont(r)acted to talk at the forum.  At this moment negotiations with a hotel in the Netherlands are taking place to have the forum close to the airport of Amsterdam.

More information will follow in the coming weeks or months, but I wanted to share this announcement with you as early as possible to make sure you can keep your agenda free on these days.

Albert,

04-04-2013.

How to Measure Non-Linearity ? (1)

March 26th, 2013

The non-linearity of an image sensor is indicating the deviation of the output signal from an ideal straight line (at least for a linear device).  To measure the non-linearity one should obtain the output data of the imager for a range of know exposure levels.  These can be generated by means of :

–       using a changing light source at a fixed integration or exposure time,

–       using a fixed light source, but change the integration or exposure time of the sensor.

Other simple tricks to change the amount of light to the sensor, is to create a smear signal in frame-transfer and full-frame CCDs.  Just before a frame is being readout, it is first reset so that no actual video data is contained in the sensor. After the reset, the sensor is being readout with light shining on it.  In this way the output signal is composed only out of smear.  And the smear is constantly increasing from line to line.  In this way a variable light input is created from line to line.  A similar effect can be obtained in a 3T or 4T CMOS pixel : after a global reset of the pixels, the sensor is immediately read out in a rolling shutter mode.  Note that in these two situations,  a uniform illumination of the sensor is needed.

To measure the linearity of the pixels, it should be clear that a light source is needed that is stable over time, and does not change its colour temperature.

In the measurements that will be reported here, a fixed light source is used, based on a small LED backlight illumination, and the amount of photons coming to the sensor is changed by manipulating the exposure time.

Next question that needs to be answered : how is the non-linearity defined and calculated ?  And here a distinction is made between the integral non-linearity and the differential non-linearity.

Integral non-linearity (INL).

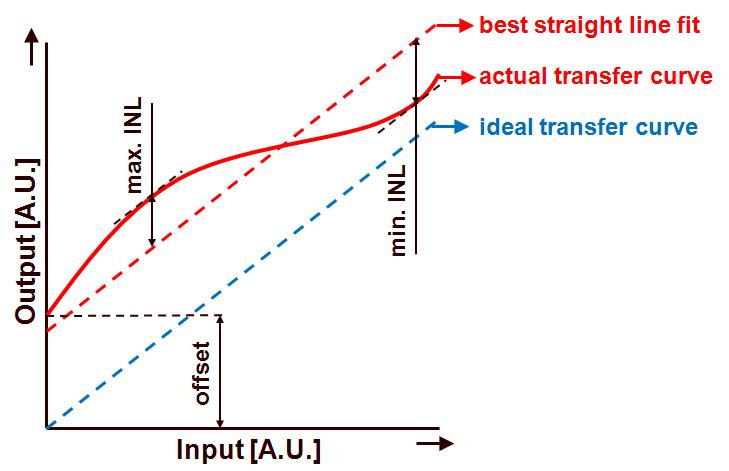
The integral non-linearity is described as the deviation of an actual transfer function from a straight line.  The definition is depicted in the illustration below :

The following curves are being shown in the figure :

–       the ideal transfer curve,

–       the actual transfer curve, linking the output of the sensor to its input,

–       the best straight line fit through the actual transfer curve.

As can be seen from the figure, the best straight line fit to the actual transfer curve runs in parallel to the ideal transfer curve, but both lines not necessarily pass through the origin of the axes. Once the best straight line fit is obtained, the maximum positive deviation (indicated on the figure as maximum INL) and the maximum negative deviation (indicated on the figure as minimum INL) can be calculated.  The INL can then be expressed as the peak-to-peak value of these deviations, their peak values or their average value (based on the absolute value of the maximum and minimum INL value).  These numbers can be expressed in percentage of the full-scale or as a number of LSB’s.

Differential non-linearity (DNL).

Starting from the DNL definition of an ADC, being “DNL is the difference between an actual step width and the ideal value of 1 LSB”, the DNL for an imager can be written as : “DNL is the difference between two actual output levels obtained from two consecutive measurements and their ideal values”.  The DNL can also be expressed as a maximum value and a minimum value, a peak-to-peak value or an average value.  Based on its definition, the DNL is always normalized to an ideal step size.  And in the case of an imager, this is the step between two measurment points.

Next time measurement results for INL and DNL will be shown.

Albert, 25-03-2013.

International Solid-State Circuits Conference 2013 (4)

February 25th, 2013

“A 3D vision 2.1 Mpixels image sensor for single-lens camera systems”, by S.Koyama of Panasonic.  The basic idea is to perform depth sensing by means of a “standard” 2D image sensor.  To do so, every pair of horizontal pixels is provided with one lenticular lens (cylindric).  This is resulting in the structure that one pixel of the pair “looks” to the left incoming beams (= left eye), and the other pixel of the pair “looks” to the right incoming beams (= right eye).  Based on the difference in information, the depth can be measured.  Simple idea, but a few important items need to reported :

–       The standard Bayer pattern is no longer applicable, because the two paired pixels need to have the same color.  So the CFA is a kind of Bayer pattern that is stretched in horizontal direction across two pixels,

–       The real difficult part of this concept is located in the digital micro-lenses that are located on every individual pixel and that are located between the silicon and the lenticular lens.  These digital micro-lenses are/were described elsewhere, but it looks that they are key to this idea, especially for the pixels that are situated towards the edges of the image sensor,

–       The method works only with low F numbers for the main lens (e.g. F1.4).

Measurement results show that the “left eye” and the “right eye” really can discriminate between various angles of incidence.  Their peak sensitivity is 2 times larger than a classical pixel, basically showing that 3D is working very efficiently (2 times is the best you can get because you bring all information from 2 pixels into a single pixel).

“A 187.5 uVrms read noise 51 mW 1.4 Mpixel CMOS image sensor with PMOSCAP column CDS and 10b self-differential offset-cancelled pipeline SAR-ADC”, by J. Deguchi (Toshiba).  By using pMOS capacitors in the columns to perform CDS, 50 % of the area can be saved because of the high intrinsic capacitance value of the pMOS.  The capacitors were not only applied in the CDS circuitry but also elsewhere in the controller, resulting in a lower area and a power reduction of 40 %.  A similar story for the CDAC in the ADC : a size of 50 % and a power of only 20 % compared to previously reported devices.  Besides all this good news, a noise level of 4.5 electrons was shown (take into account that the conversion gain is “only” 41.8 uV/electron).

Albert, 24-01-2013.


International Solid-State Circuits Conference 2013 (3)

February 23rd, 2013

Paper presented by L. Braga (FBK, Trento) : “An 8×16 pixel 92kSPAD time-resolved sensor with on-pixel 64 ps 12b TDC and 100MS/s real-time energy histogramming in 0.13 um CIS technology for PET/MRI applications”. After the introduction about PET and various sensor options for PET, the author gave details about his own sensor architecture, called a mini Si-PM. One of the known limitations of SPADs is their small fill factor, but apparently by making the fill factor larger, also the dark-count rate and the yield are worsen more-than-linearly with the area. So instead of using one large SPAD, many smaller SPADs are arranged in a parallel structure. All these smaller SPADs are combined in a large OR-tree, but to avoid too much overlap of the dead times of all the SPADs, several monostables are incorporated in the OR-tree. This results in a spatial as well as temporal compression with 300 ps pulses every time one of the SPADs in the OR-tree is fired. One level higher in hierarchy, the 8×16 pixels are connected in a large H-tree to avoid differences in delays. The overall chip contains 92k SPADs (8 x 16 pixels each having 720 SPADs with 42.6 % fill factor, all connected to one single active time-to-digital converter).

During the presentation several measurements were shown to illustrate the working of this large SPAD chip.

Paper presented by C. Niclass (Toyota) : “A 0.18 um CMOS SoC for a 100m range, 10 fps 200×96 pixel Time of Flight depth sensor”. This chip has a novel idea to discriminate the ToF signal from the background by spatiotemporal correlation of photons. The idea is based on recording the time of arrival of each photon (background + ToF signal) and by making a kind of histogram in the time domain of these arrival times, the ToF signal can be discriminated from the background. The sensor is only 96 pixel in height, and to extend the vertical resolution, a scanning method with a rotating polygon mirror with 6 facets is used. The sensor itself contains a “row” of ToF detectors, as well as a “row” of standard intensity detectors. The ToF pixels are based on SPADs, information about the standard intensity detectors is not given.

The complete chip is relatively large : 4.7 mm x 6.7 mm, while the pixels only take up about 2 x 0.15 mm x 1.6 mm (guess !). So a huge amount of the chip area is used for memory, DSP, TDC, etc. Evaluation results show a very high accuracy of the distance measurements. According to the presenter, this chip is outperforming all other state-of-the-art technologies.

Paper presented by O. Shcherbakova (University of Trento) : “3D camera based on linear-mode gain-modulated avalanche photodiodes”. The technology described in this paper tries to improve the existing 3D sensors w.r.t. power consumption, frame rate and precision. The ToF method applied is making use of the continuous wave ToF. The heart of the sensor is the photodetector plus the demodulator of the signal and these are based on avalanche photodiodes. The device is fabricated in 0.35 um CMOS 1P4M, pixels are 30 um x 30 um with a fill factor of 25.7 %. The demodulation contrast reported is pretty high : 80 % at 200 MHz and 650 nm, maximum frame rate 200 fps. The precision of the depth sensing is 1.9 cm at 2m distance and 5.7 cm at 4.75 m distance. Worthwhile to mention : this paper had a live demonstration during the demo-session, the only one of the image sensor session.

Albert, 23-01-2013.

International Solid-State Circuits Conference 2013 (2)

February 22nd, 2013

Next are two (short = 15 min) presentations of imagers with a 3D-fabrication technology.  The first paper was coming from Olympus, entitled “A rolling-shutter distortion-free 3D stacked image sensor with -160 dB parasitic light sensitivity in-pixel storage node”, by J. Aoki.  The device is made out of a double layer structure : the top layer holds the BSI photodiode array, the bottom layer has the storage as well as the column processing present.  The architecture of the pixels is a 4-shared BSI-PPD pixel structures with all 4 photodiodes, four transfer transistors, one floating diffusion one reset transistor and one source follower in the top layer.  Next a bump is connecting the source follower from the top layer to the bottom layer.  In the latter the select transistor is present plus 4 sample-and-hold switches and capacitors.  These are acting as the storage nodes to construct the global shutter.  Next these storage nodes are provided with an individual source follower and select transistor.  So for every group of 4 pixels, one micro-bump is needed to provide the electrical contact.  Between the two layer an opaque shield is inserted to shield the storage nodes from any incoming light.  That is the explanation of the -160 dB light shielding efficiency.

Very simple, but apparently very efficient solution.  Nevertheless only very limited performance data was shown.  Pixel size is 4.3 um x 4.3 um, 30 frames/s, minimum bump pitch 8.6 um, 704 x 512 pixels and fabricated in 0.18 um 1P6M process.  Unfortunately no data about noise or dark current.  Remarkable is the mentioned full well capacity : 30,000 HOLES.  Although no further comments were given (neither asked) : this is a hole detector with all circuitry based on p-MOS transistors.

Next on in line was the Sony presentation by S. Sukegawa : “A 1/4-inch 8M pixel back-illuminated stacked CMOS image sensor”.  The basic idea is to use the carrier substrate of the BSI structure as an active layer and put all the circuitry onto/into this carrier layer.  Very simple, straight forward but a challenging technology !  In the device presented, the connection between the two layers is made by TSVs.  These TSVs are located at the outside of the die, so no connections or TSVs in the active area.  Unfortunately no pictures or cross-sections, neither any data was given about the TSVs.

As far as circuitry on the top layer is concerned, the following is included : full imaging array, addressing means as well as the comparators in the column circuitry which are front-end part of the column-level ADC.  The counters, being the back-end part of the column-level ADCs are located in the second layer.  This architecture suggests that every column has a TSV, or that a limited number of TSVs is used in combination with a multiplexer and de-multiplexer.  But no information was given about this.

The top part was fabricated in a 90 nm CIS process, the bottom part in a 65 nm logic process, containing 2.4 Mgates.  The overall chip size is 70 % of the one that was made in one single layer.

As far as the CFA is concerned : RGBW arrangement is used, firstly reshaped in a Bayer pattern and next demosaiced.  The device also has the option to alternately have lines with long and lines with short exposure time to extend the dynamic range.  So overall it is not surprising that that many logic gates are used in the bottom layer, it contains a lot of image processing stuff.  Some key performance parameters : 5000 electrons full well for a pixel of 1.12 um x 1.12 um, 30 fps in full resolution, 2.2 electrons of noise with an analog gain of 18 dB and a conversion gain of 63.2 uV/electron.

Albert, 22-01-2013.


International Solid-State Circuits Conference 2013 (1)

February 21st, 2013

Today, Wednesday 21th, 2013, the imagers were presented at the ISSCC in San Francisco.  In this (and more-to-come) blog I would like to give a short review of the presented material.  As usual I try to do this without figures or drawings, not to violate any copyrights of the authors and/or of ISSCC.

The image sensor session kicked off with two papers from University of Michigan.  The first one, delivered by J. Choi was entitled “A 3.4 uW CMOS image sensor with embedded feature-extraction algorithm for motion-triggered object-of-interest imaging”.  The basic idea is to develop an imager that can be used in a large sensor network and will be characterized by a minimum power consumption.  For this purpose, a motion-triggered sensor is developed.  That is not really new, but in the paper, once the sensor is triggered it moves into an object-of-interest mode, instead of a region-of-interest.  So the sensor recognizes persons and tries to track them.  All circuitry needed for that is included in the pixel and/or on the chip.

In standard (sleeping) mode the sensor delivers a 1-bit motion sensing frame, once a moving object is recognized, the sensor wakes up and switches into an 8-bit object detection and object tracking mode.  Technically seen, the sensor has a pretty clever pixel design, with an in-pixel memory capacitor for frame storage (to be used to detect motion).  But most inventive is the combination of the circuitry of two pixels to build a low-power output stage, operated at 1.8 V.  So the pixel circuitry is reconfigurable depending on the mode of operation, this reconfigurability allows the low voltage supply and results in the low power.   

The recognition of objects (persons) is based on a “gradient-to-angle” converter, which is implemented on-chip.  By making smart use of simple switched-capacitor circuitry, complicated trigonometric calculations can be avoided. 

Second paper of the same university was delivered by G. Kim : “A 467 nW CMOS visual motion sensor with temporal averaging and pixel aggregation”.  Basically the same application : ultra-low power sensor with motion detection to wake up the sensor.  The device developed makes use of 4 different pixel designs/functionalities in every 8 x 8 kernel of pixels.  These different type of pixels allow the sensor to extend its range of motion detection, from slow motion of the objects to fast motion of the objects.  The “temporal averaging” in the title of the paper is referring to one of the pixel types with a long exposure time, the “pixel aggregation” in the title of the paper is referring to the aggregation/summation of signals coming from 16 pixel out of the group of 8 x 8 pixels. 

Worthwhile to notice : the device is fabricated in a standard logic 0.13 um CMOS process. 1P8M, so no PPD !  During the paper presentation, the author gave a lot of details about the design as well as about the working principle of the various pixels. 

Albert, 22-01-2013.


Status “How To Measure … ?” series

January 28th, 2013

It has been a while since the last post in the series “How To Measure … ?”  Unfortunately the writing-up of this material has not the highest priority I have to admit.  Another problem has to do with the need for new/additional measurement data, but to generate the data I do need a set-up, and to use the set-up I do need a lab.  At this moment I am busy with the installation of the lab in my new office space, some new equipment has arrived already, including a nice light-tight measurement box that will be used to do the measurements.  So in principle I can start with new measurements on a short notice (if time allows me).  But in many cases after the measurement data is available, some data processing is needed to present the results in an understandable way. 

What can you expect to be the next ?  Most probably the next chapter will deal the measurement of the linearity and/or full-well capacity of the sensors/cameras.  Looking forward to it, because it is funny to realize how much one (still) can learn by doing these evaluations.

Albert. 28-01-2013.