The non-linearity of an image sensor is indicating the deviation of the output signal from an ideal straight line (at least for a linear device). To measure the non-linearity one should obtain the output data of the imager for a range of know exposure levels. These can be generated by means of :
– using a changing light source at a fixed integration or exposure time,
– using a fixed light source, but change the integration or exposure time of the sensor.
Other simple tricks to change the amount of light to the sensor, is to create a smear signal in frame-transfer and full-frame CCDs. Just before a frame is being readout, it is first reset so that no actual video data is contained in the sensor. After the reset, the sensor is being readout with light shining on it. In this way the output signal is composed only out of smear. And the smear is constantly increasing from line to line. In this way a variable light input is created from line to line. A similar effect can be obtained in a 3T or 4T CMOS pixel : after a global reset of the pixels, the sensor is immediately read out in a rolling shutter mode. Note that in these two situations, a uniform illumination of the sensor is needed.
To measure the linearity of the pixels, it should be clear that a light source is needed that is stable over time, and does not change its colour temperature.
In the measurements that will be reported here, a fixed light source is used, based on a small LED backlight illumination, and the amount of photons coming to the sensor is changed by manipulating the exposure time.
Next question that needs to be answered : how is the non-linearity defined and calculated ? And here a distinction is made between the integral non-linearity and the differential non-linearity.
Integral non-linearity (INL).
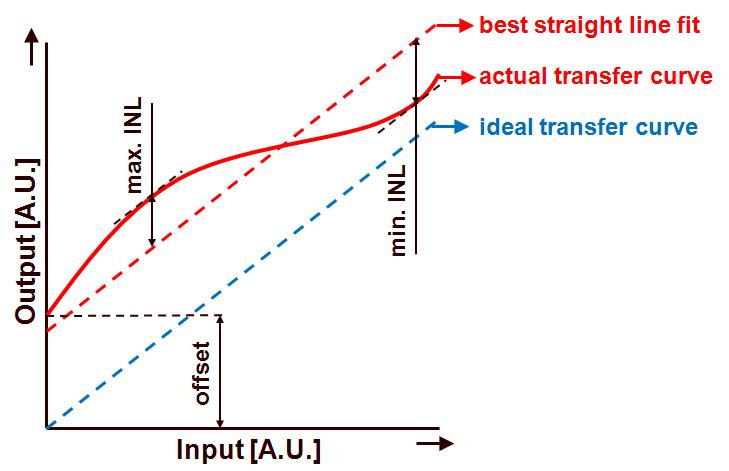
The integral non-linearity is described as the deviation of an actual transfer function from a straight line. The definition is depicted in the illustration below :
The following curves are being shown in the figure :
– the ideal transfer curve,
– the actual transfer curve, linking the output of the sensor to its input,
– the best straight line fit through the actual transfer curve.
As can be seen from the figure, the best straight line fit to the actual transfer curve runs in parallel to the ideal transfer curve, but both lines not necessarily pass through the origin of the axes. Once the best straight line fit is obtained, the maximum positive deviation (indicated on the figure as maximum INL) and the maximum negative deviation (indicated on the figure as minimum INL) can be calculated. The INL can then be expressed as the peak-to-peak value of these deviations, their peak values or their average value (based on the absolute value of the maximum and minimum INL value). These numbers can be expressed in percentage of the full-scale or as a number of LSB’s.
Differential non-linearity (DNL).
Starting from the DNL definition of an ADC, being “DNL is the difference between an actual step width and the ideal value of 1 LSB”, the DNL for an imager can be written as : “DNL is the difference between two actual output levels obtained from two consecutive measurements and their ideal values”. The DNL can also be expressed as a maximum value and a minimum value, a peak-to-peak value or an average value. Based on its definition, the DNL is always normalized to an ideal step size. And in the case of an imager, this is the step between two measurment points.
Next time measurement results for INL and DNL will be shown.
Albert, 25-03-2013.
