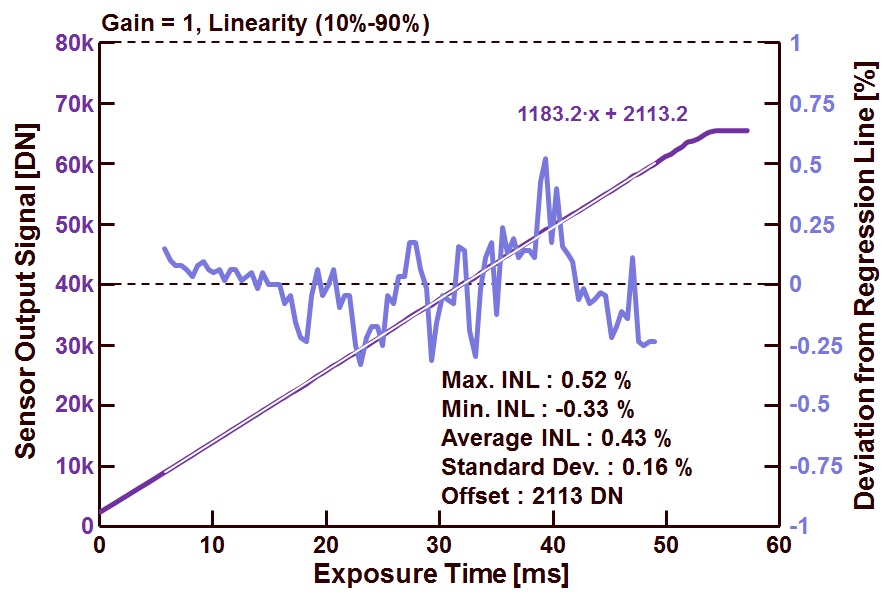
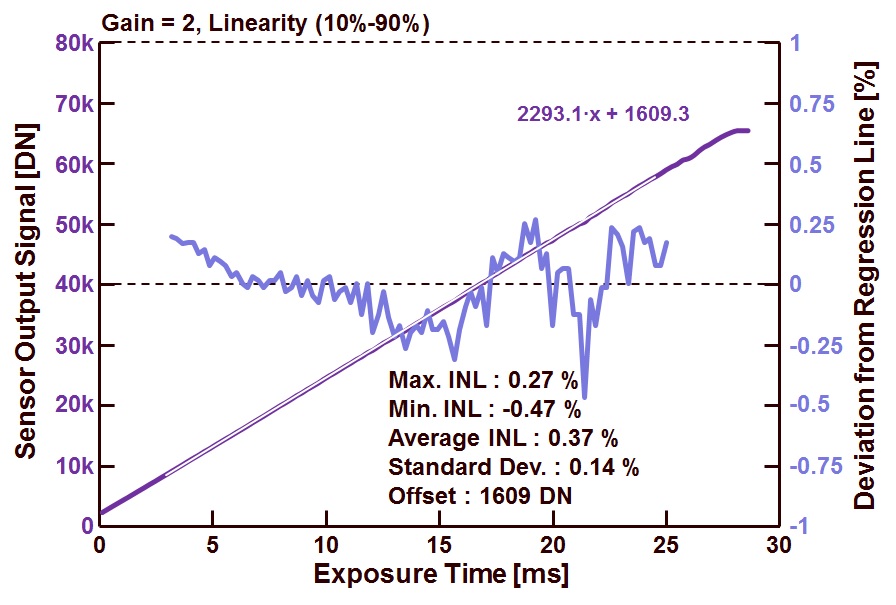
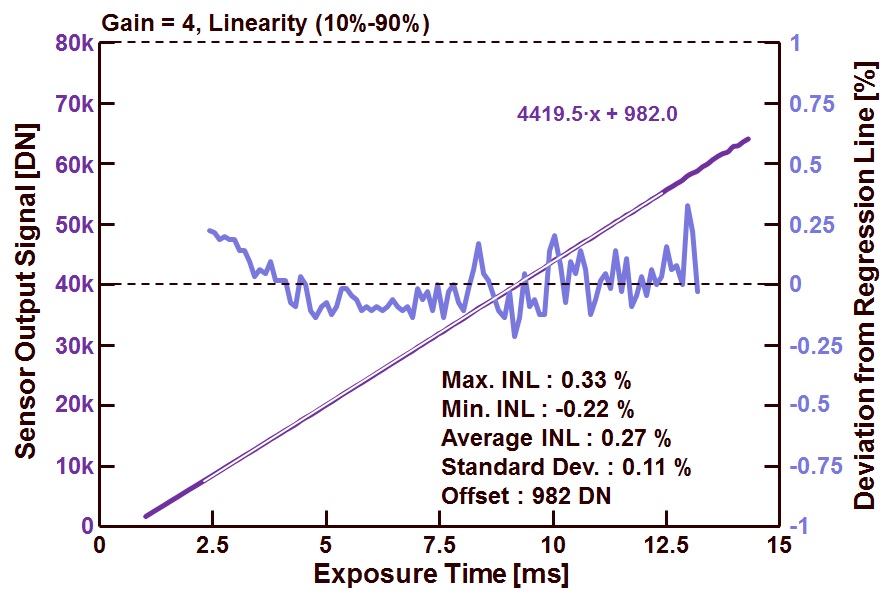
After checking out the linearity of the sensor/camera with a gain set to unity, in this blog the linearity will be checked in the case the sensor/camera gain is set to 2 and 4. In all three cases (gain = 1, 2 and 4) the linearity will be checked for an output swing of the sensor between 10 % and 90 % of the saturation level. Figures 1-3 contain the obtained results.
Figure 1 : Camera output and INL for an output range between 10 % and 90 % of saturation and a sensor/camera gain setting equal to 1.
Figure 2 : Camera output and INL for an output range between 10 % and 90 % of saturation and a sensor/camera gain setting equal to 2.
Figure 3 : Camera output and INL for an output range between 10 % and 90 % of saturation and a sensor/camera gain setting equal to 4.
Some remarks :
– All output signals in all figures have a fairly abrupt transition from their linear behaviour towards saturation. This is due to the fact that the ADC is defining the maximum output signal and not the pixel or the source-follower. This was already the case with the measurements presented in the previous blog with gain = 1. So by increasing the gain of the sensor/camera, this saturation effect does not change,
– All definitions used in this characterization of the INL are described in the previous blogs,
– The results reported here come from an group of 50 x 50 pixels, and the graphs show the average non-linearity of these 2500 pixels,
– The three graphs show (more or less) a similar behaviour of the non-linearity. It should be noted that not only the gain of the sensor/camera is changed, but also the amount of light is changed by adapting the exposure time. The light source itself is not changed. Although the graphs have a different horizontal axis, all three of them :
- Cover different output swings of the photodiode,
- Cover different output swings of the floating diffusion,
- Cover the same output swing of the output amplifier.
With a bit of imagination, one can recognize that the INL shows more or less the same behaviour for all 3 situations and in all cases, and it remains fairly low, even if the gain is increased by a factor of 4. This observation can lead to the conclusion that the non-linearity measured is not due to the non-linearity in the pixel, but most probably coming from the amplifier located in the (analog) output chain (a so-called V/V non-linearity).
Till now, the INL is characterized within 4 different sections of the output swing (1%-99%, 5%-95%, 10%-90%, 20%-80%) and for 3 different settings of the gain (1, 2 and 4). All results are summarized in the table below.
|
Gain |
Output swing (%) |
Max. INL (%) |
Min. INL (%) |
Average INL (%) |
St.Dev. (%) |
Offset (DN) |
| 1 | 1-99 | 0.62 | -0.74 | 0.68 | 0.21 | 2198 |
| 1 | 5-95 | 0.57 | -0.38 | 0.47 | 0.16 | 2147 |
| 1 | 10-90 | 0.52 | -0.33 | 0.43 | 0.16 | 2113 |
| 1 | 20-90 | 0.43 | -0.35 | 0.39 | 0.14 | 1919 |
|
2 |
1-99 |
0.33 |
-0.42 |
0.38 |
0.16 |
1684 |
|
2 |
5-95 |
0.28 |
-0.44 |
0.36 |
0.16 |
1650 |
|
2 |
10-90 |
0.27 |
-0.47 |
0.37 |
0.14 |
1609 |
|
2 |
20-90 |
0.31 |
-0.41 |
0.36 |
0.13 |
1576 |
|
4 |
1-99 |
0.43 |
-0.25 |
0.34 |
0.16 |
1029 |
|
4 |
5-95 |
0.40 |
-0.25 |
0.33 |
0.14 |
1013 |
|
4 |
10-90 |
0.33 |
-0.22 |
0.27 |
0.11 |
982 |
|
4 |
20-90 |
0.22 |
-0.19 |
0.20 |
0.08 |
893 |
All data is coming from the same sensor and from the same group of pixels, but a lot of different numbers can be observed. So the same conclusion can be made as last time : in the case of INL characterization, it is of crucial importance to specify all parameters and settings of the sensor/camera as well as the conditions for measuring/calculating the integral non-linearity.
What’s up next time ? Then the focus will be put on the INL of the individual pixels.
Albert, 22-04-2013.


