Further Comments on Noise Measurements

September 9th, 2012

When characterizing the noise of an imager (temporal or fixed-pattern) by means of a single number (that is what we did in the previous blogs), one should be cautious with the interpretation of that single result.  A single number does not tell anything about the distribution of the noise, does not give any information about outliers, does not give any information about the physical location of pixels with a high or low noise level.  Performing a global noise measurement and characterizing the noise behavior of an imager by means of a single number can still work well in the case the noise is dominated by a global noise source, e.g. the output amplifier of a CCD.  On the other hand, a single number for the noise is very often found in data sheet, but actually it can hide a lot of information.

But these days with amplifiers in every CMOS pixel, addressing circuitry on row level and analog circuitry on column level, it is absolutely recommended to perform more noise analysis to get a better insight in the origins of the noise.  The following techniques can be of interest :

–       Generating a noise distribution histogram if the noise is present on pixel level.  In the case that the average noise level is dominated by outliers, it may be worthwhile to correct these outliers (by menas of a simple defect correction algorithm) and perform the noise calculation again,

–       Calculating the noise on row level and on column level : this can give information about the origin of the noise, whether the dominant noise source is located in the column circuitry or row circuitry,

–       Performing frequency analysis (by means of a FFT) on the row level and column level noise to find out if there exists any repetitive pattern in these noise sources,

–       Calculating the noise on pixel level, by subtracting the column and row noise from the total noise,

–       Calculating the minimum quantisation noise of the ADC (if present on the chip),

–       Measuring the noise of the “global” output stage by applying different gains to this output amplifier (if possible).

The technique of noise measurements is not that difficult.  With a computer and a frame grabber one can do an excellent job.  In most cases it is just a matter of calculating average values and standard deviations on the data present in images.  The trick is to perform them in the right order !

Over the last decade the noise performance of the imagers has increased quite a lot, for instance due to semiconductor technology improvements and advanced circuitry/design techniques.  As a result, the characterization of the noise with a high accuracy is becoming more and more challenging.  For that reason one should pay more and more attention to the measurement set-up as well.  A few hints :

–       Temperature of the sensor (which is not necessarily the same as the environment temperature) should be stable within 1oC.  Even the smallest temperature increase will increase the dark current and its shot noise component,

–       In the case that light is used as an input signal, the light source should be stable (intensity and colour temperature) and a DC light source has to be used.  Uniformity of the light across the pixels should be “perfect” when various pixels will be compared with each other, as for instance done with PRNU measurements.  If the case noise measurements are performend, one is should measure non-uniformities of the sensor and not non-uniformities of the light source.

–       Measurements without light need to be done in dark !  Just avoiding light input by simply capping the camera lens is not enough to put a sensor in complete darkness.

Good luck with the measurements and have fun !

Albert, 09-09-2012.

How To Measure “Photon Transfer Curve” (1) ?

August 28th, 2012

Over the last few years a lot of information about the Photon Transfer Curve (PTC) is being published in this blog.  The influence of many different sensor parameters on the PTC was studied and described.  For those of you that are still hungry to get more information, please remember that Jim Janesick wrote a complete book about the PTC.  It was Jim who developed this wonderful technique in the ‘80s for CCDs, but the PTC is perfectly applicable to CMOS imagers as well.  The great advantage of this measuring method is the fact that no absolute measurements of any light input is needed. 

In this blog, the application of the PTC on the data/images collected earlier will be described.  So the same images (with light on the sensor) as used in the previous blogs are being re-used.  What was done to generate these images : the sensor under test was uniformly exposed to light, while varying the exposure time.  For every exposure time applied, several images were grabbed, the average value of the obtained images as well as the temporal noise on pixel level was calculated. 

The measured signal of the sensor can be written as :

Stot = kNo + Soff    (1)

While the measured temporal noise on pixel level can be written as :

stot2 = k2sR2 + k2so2  (2)

with :

       Stot : measured output signal [DN],

       k : conversion gain [DN/e],

       No : number of optically generated electrons,

       Soff : offset signal [DN],

       stot : total temporal noise measured [DN],

       sR : temporal noise associated with the readout channel [e], also the noise floor in dark at 0 s exposure time,

       so : photon shot noise [e].

And with :

so2 = No = (Stot – Soff)/k       (3)

the total noise can be written as :

stot2 = k2sR2 + k(Stot – Soff).    (4)

The signal-to-noise ratio of the system under consideration can be written as :

                                    Stot/stot = (Stot-Soff)/( k2sR2 + k(Stot – Soff))0.5.     (5)

The obtained measurement data/images can be used to create :

1)    Standard deviation versus average effective signal, both on a log-scale (“Mean-Standard Deviation”).


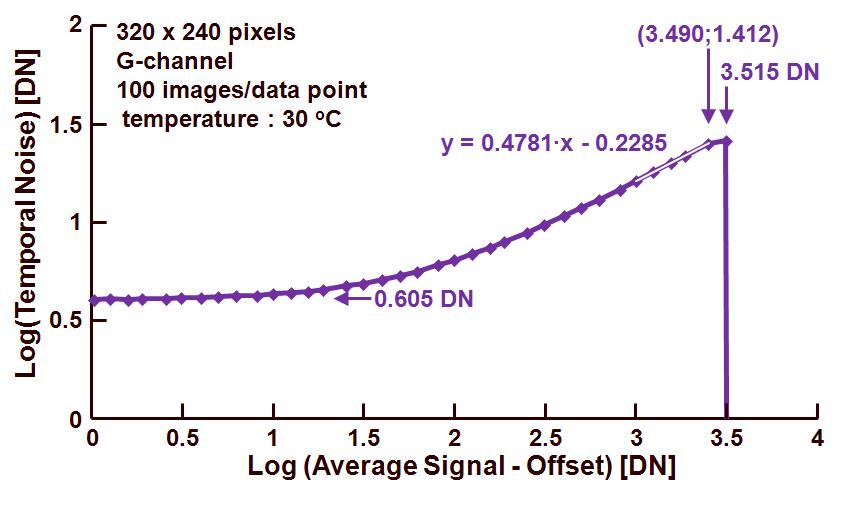
The standard deviation is representing the temporal noise of the pixels, the effective signal is equal to the average output signal minus the DC-offset of the output signal.  The obtained curve is shown in Figure 1.
120827_blog_1

 Figure 1. Photon Transfer Curve : standard deviation versus effective output signal.

From left to right, one can recognize three parts in this PTC graph :

       A flat part in which the temporal noise of the readout channel or the noise floor at 0 s exposure time, is dominant, in the example shown this noise is equal to 100.605 DN = 4.03 DN.  This can also be derived from equation (4) and scrapping the photon shot noise :

           stot2 = k2sR2    or    stot = ksR.

       A part with increasing noise for increasing effective signal, in this region the photon shot noise is dominant, and the slope of the curve needs to be equal to 0.5 (or at least very close to this value).  The regression line drawn through this part of the curve is characterized by the relation shown in the graph.  Using equation (4) again, but this time focusing on the photon shot noise, it reduces to :


    stot2 = k(Stot – Soff)    or    k = 1/(Stot – Soff) at stot = 1 DN.


In this way the conversion gain k can be found by extrapolation of the regression line towards the crossing with the horizontal axis.  The value found for k is : 10-(0.2285/0.4781) = 0.33 DN/e.  Be aware that this method actually requires the curve to get a slope = 0.5 before any extrapolation can be done.  In this example the slope is only 0.4781.  Although this value is pretty close to 0.5, a substantial error can be introduced into the calculation of the conversion factor.  For that reason a better method to find the conversion factor is in the “Mean-Variance” technique, explained further in this blog.


       The part at which the noise reaches a maximum value and for any further increase in effective signal, the curve collapses.  This is the point at which the pixels reach their saturation level.  In the example shown, this happens for an effective output signal equal to 103.515 DN = 3273.0 DN.


2)    Variance versus average effective signal, both on a linear scale (“Mean-Variance”).

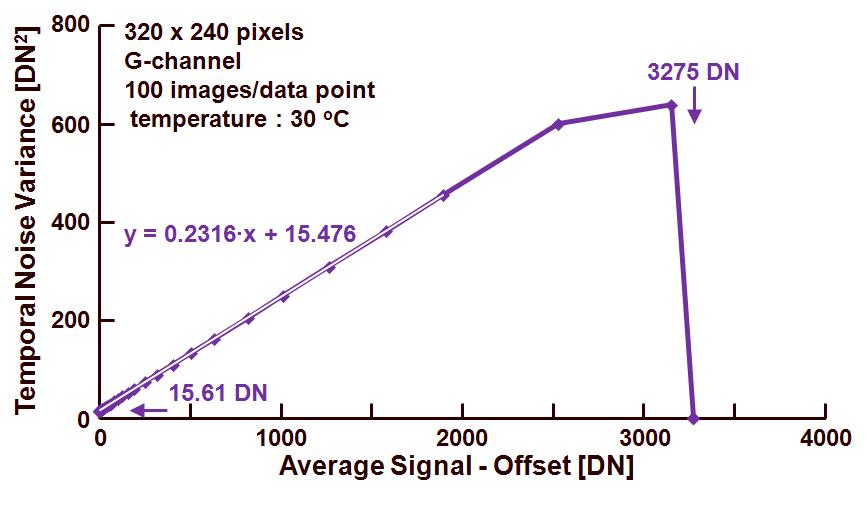
The curve obtained is illustrated in Figure 2.
120827_blog_2

Figure 2. Photon Transfer Curve : noise variance versus effective output signal.

Also this figure shows some interesting features from left to right :

       Crossing with the vertical axes (= 0 DN effective signal) for a noise variance equal to 15.61 DN.  This value corresponds to the temporal noise at very low signal values or noise floor in dark for 0 s exposure time, and actually should represent the variance of the noise associated with the readout channel.  The value found here is 15.610.5 DN = 3.95 DN.


       A linear part in the curve for which the relation is shown in the figure.  In this region again formula (4) is valid :

     stot2 = k2sR2 + k(Stot – Soff).


Taking into account the relationship of the regression line, it should be concluded that the conversion gain k (being the slope of the line) is equal to 0.23 DN/e.  This value is lower than the one previously found with the Mean-Standard Deviation method.  This is due to the fact that there is a relative large error introduced in the calculation because the slope of the noise versus signal curve is not perfectly equal to 0.5 !


       A saturation part with a collapsing curve for a maximum signal level of 3275 DN, being the saturation level of the pixels.


3)    Signal-to-noise ratio versus average effective signal, both on a log-scale (“Mean-Signal-to-Noise”).

The relation between signal-to-noise ration and effective signal is shown in Figure 3.
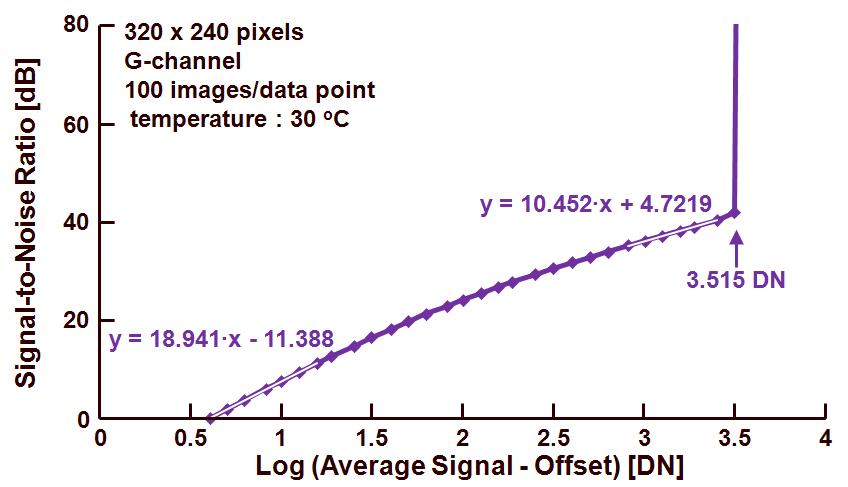
120827_blog_3 Figure 3. Photon Transfer Curve : signal-to-noise ratio versus effective output signal.

A similar story as before can be repeated about three different regions in the curve :

       At the very left end a first part that can be linearized is indicated by the relation between signal-to-noise and average effective signal.  In this region the noise of the readout channel is dominant, and based on equation (5), the signal-to-noise ratio can be written as :

         Stot/stot = (Stot-Soff)/(ksR)    or    ksR=Stot-Soff at Stot/stot = 1.

In this example, the readout noise is equal to 1011.388/18.941 = 3.99 DN.

       Just before saturation, a second linear part can be recognized in the region where the photon shot noise is the dominant noise source, and based on equation (5), the signal-to-noise ratio can be simplified to :

          Stot/stot = ((Stot-Soff)/k)0.5    or    k = 1/(Stot-Soff) at Stot/stot = 1.

In this example, the conversion gain is equal to 104.7219/10.452 = 0.35 DN/e.  Also this value deviates from the previously calculated values, because the extrapolation of the data can introduce some nasty errors.

       Finally the signal-to-noise ratio is becoming extremely large, due to the fact that the temporal noise of the sensor is reduced to almost zero at saturation of the pixels for a value of 103.515 DN = 3273 DN.

In conclusion, parameters such as the readout noise or noise floor in dark, the conversion gain and the saturation level can be found by means of the Photon Transfer Curve.  But the most accurate and reliable data for (although 3 different curves are used, the input data for these curves is the same) :

       the conversion gain can be obtained via the Mean-Variance curve,

       the readout noise or noise floor in dark at 0 s exposure time, can be obtained via the Mean-Standard Deviation curve,

       the saturation level can be obtained by any form of PTC.  

The PTC curve can be constructed in various ways.  In this blog uniform illuminated sensor areas at various exposure times are used, in the next blog a few alternatives will be highlighted.

Albert, 27-08-2012.

How To Measure Temporal Noise with Light ?

August 13th, 2012


It is again time to switch on the light and to measure the temporal noise of a sensor with light input.  Actually, do not expect that much new information with this measurement as far as noise is concerned.  Once there is light shining on the sensor and once the sensor is delivering enough signal, the photon shot noise will be the largest noise component and the measurement results will be dominated by this photon shot noise .  And it is known that the photon shot noise (expressed in electrons) has a square-root relation with the amount of electrons generated in the pixels.  There is no real need to proof the Poisson statistics again, others have done this already millions of time. 

When measuring the temporal noise, it must be admitted that most interesting information is already found in the sessions without light input and with an exposure time equal to 0 s.  Nevertheless, to complete the story about temporal noise measurements, also the evaluation of temporal noise with light will be discussed in this blog. 

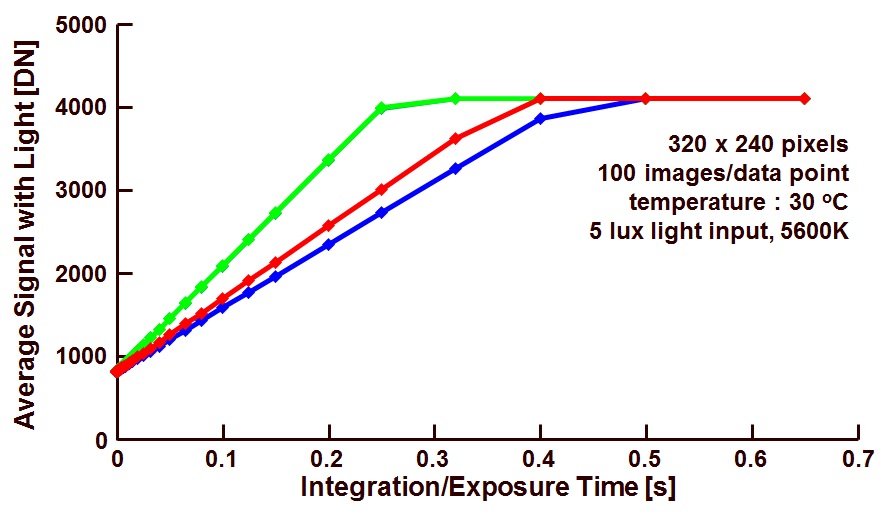
Figure 1 repeats the average output signal of the sensor, with light input, as a function of the exposure time.  This information is already shown in an earlier blog.

next_blog_1


Figure 1. Average output signal, with light input, as a function of the exposure time.

As can be expected, the various colours in Figure 1 represent the four colour channels of the device (red, green in red line, green in blue line and blue).  The following remarks can be made :

       Offset at 0 s exposure time, being equal for all colour channels, being 820 DN,

       Saturation level being equal for all colour channels, the saturation levels are equal to 4095 DN.  So the saturation level of the signals is determined by the maximum level of the ADC (being 212 -1 DN = 4095 DN).  With the correction of the offset, the sensor delivers maximum 3275 DN,

       Sensitivity of the blue channel is lowest, next is red, and the most sensitive channels are the two green ones.  This observation is the case for the light input parameters indicated, 5600K colour temperature, and 5 lux on the sensor.

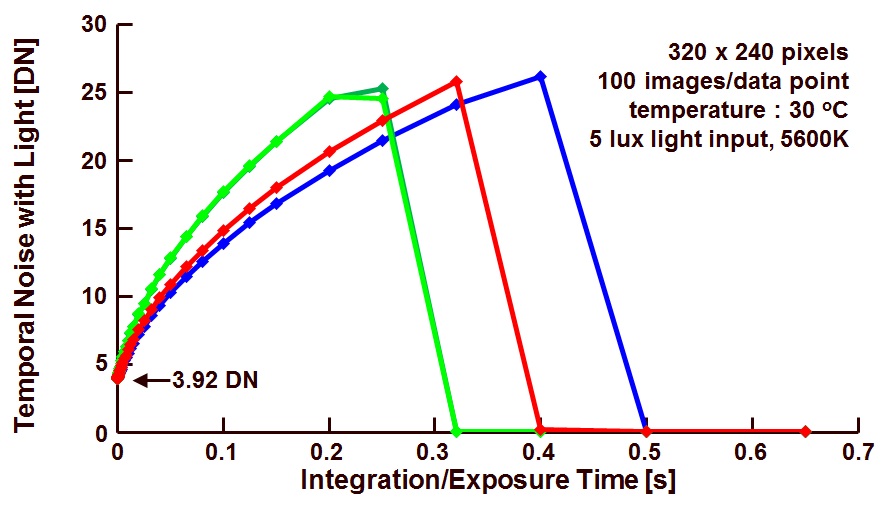
Figure 2 illustrates the measured temporal noise under the same light and sensor conditions as the one used in Figure 1.

next_blog_2


Figure 2. Temporal noise of the sensor with light input, as a function of the exposure time.

Also from this graph a few interesting remarks can be made :

       For an exposure time 0 s, the minimum noise is equal to 3.92 DN.  This is the noise floor of the sensor in dark at 0 s exposure time,

       For increasing exposure times, the noise increases as well, but in a non-linear way.  This is due to the fact that for larger exposure times, the noise is dominated by the photon shot noise, and the latter has a square-root relation with the average signal (in the charge domain),

       Because the sensitivity of the green channels is the largest of all, and the sensitivity of the blue channel is the lowest, the same is true for the noise levels at a particular exposure time,

       As soon as the signals saturate, the temporal noise is quickly dropping to a very low level.  This is due to the fact that the ADC is saturating and fixing the output value of the signal to 4095 DN and any further noise content in the analog signal does not show up in the digital representation of the output signal.

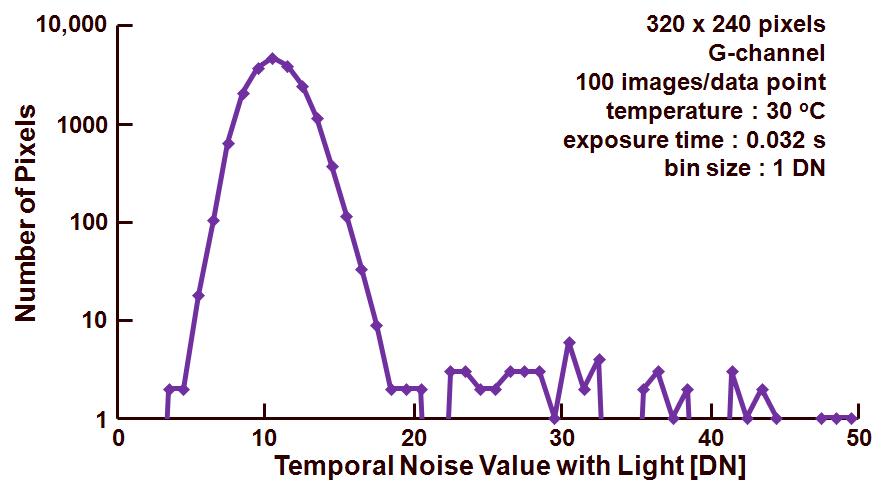
Figure 3 shows the temporal noise histogram, obtained at an exposure time of 0.032 s, at which the green channels reach 25 % of saturation.

next_blog_3


Figure 3. Noise histogram for the sensor with light, only one of the green channels is shown.

 At the left side in Figure 3, the Poission distribution of the photon shot noise can be recognized.  The tail at the right side in the histogram is representing the pixels of which the temporal noise is dominated by 1/f and RTS noise.


Albert, 13-07-2012.

How To Measure Temporal Noise in Dark ? (3)

July 5th, 2012


After measuring the noise in dark on column level, it is important to check noise in dark on row as well.  This discussion will be very much the same as the last one about column level noise.  The row level noise can be calculated based on the same data/images used for the FPN in dark and for the noise in dark on pixel and column level.  It is just a matter of applying the right order of statistical calculations.  To evaluate the noise in dark on row level, all pixels in each row are averaged and next the rms value is calculate on these averaged row values.  Once the noise for each row is known, the average value of all these rms values is calculated.

The result of this process is shown in Figure 1.  Both the temporal noise on pixel level (previous blog) and the temporal noise on row level are shown as a function of integration time.

next_blog_1


Figure 1. Temporal noise measured in dark on pixel level and on row level, as a function of the exposure or integration time.

As can be expected, the row level noise is much lower than the pixel level noise, the difference between the two curves is minimum at 0 s exposure time and at saturation.  At lower exposure times, the temporal noise of the electronic circuitry plays an important role.  For larger values of the exposure time, the dark shot noise is dominant and in that case, the averaging effect on the data removes this pixelized noise component.  At saturation, the noise is reaching its minimum value.

Numbers that are obtained from this analysis :

       At 0 s exposure time, the temporal noise on row level is 1.20 DN,

       At 25 % of saturation, and for an exposure time of 8 s, the temporal noise on column level is 1.81 DN.

next_blog_2


Figure 2.  Temporal row noise (in dark) of the pixel at 0 s and 8s exposure time.

Figure 2 shows the row noise in dark for two integration times : 0 s (to get the noise without dark shot noise) and at 8s (when the pixels contain 25 % of the full well capacity).  In both cases no repetitive pattern in the noise can be recognized, this is also verified by means of a FFT calculation.  The result of this is shown in Figure 3.

next_blog_3


 Figure 3.  FFT of the row noise calculated for an exposure time of 0 s.

As can be observed in Figure 3, there is no specific FFT signal available at a particular frequency.  From this one can conclude that the temporal row noise is randomly distributed.

Albert, 05-07-2012.

Harvest Imaging on the road

June 29th, 2012

I am writing this blog after finishing two in-house trainings in North America.  It was the first time that my hands-on class went overseas, but also the first time that the hands-on class was organized as an in-house course.  So two premieres at the same time.  A big thank you for my customers who invited me to fly over to North America and organized the in-house trainings.

This hands-on class is very unique in the training world I think, but it also costed me a lot of effort to get it running the way it now does.  Constantly changing, updating and improving is the message.  Especially the feedback I received from the participants is of crucial importance in this process.  After conducting 130+ trainings an, of course you get a very good feeling yourself whether a course is running well or not, and where to improve.  But the feedback of the participants is of crucial importance.  For that reason I would like thank all people attended the hands-on course for their great cooperation and feedback.  Including the two classes of this week, in total about 100 people have already attended the hands-on course.  Next open hands-on course will be organized in Amsterdam, Dec. 3-4, 2012.  Maybe I will meet there some of my blog-readers.  

Albert, 29-06-2012.

How To Measure Temporal Noise in Dark ? (2)

June 27th, 2012


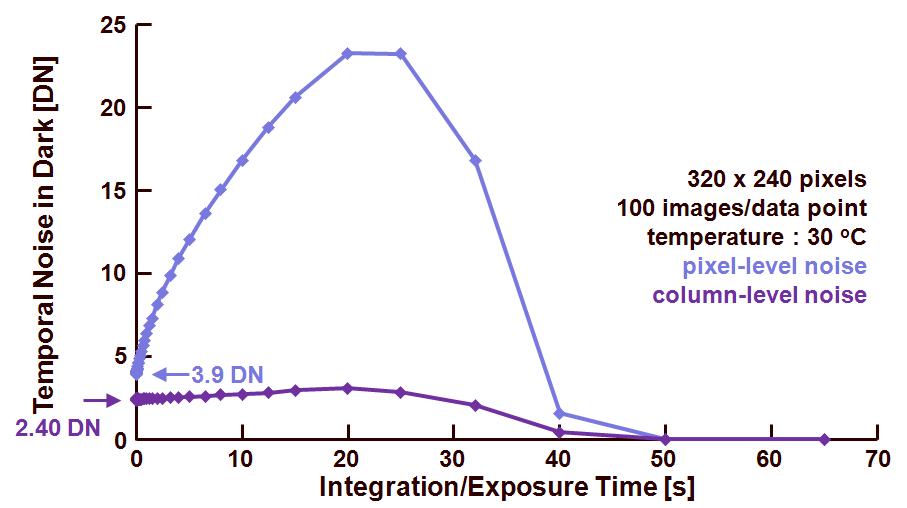
After measuring the noise in dark on pixel level, it is important to check the noise in dark on column level and on row level.  This time we will discuss the temporal noise on column level.  The latter can be calculated based on the same data/images used for the FPN in dark and used for the noise in dark on pixel level.  It is just a matter of applying the right order of statistical calculations.  To evaluate the noise in dark on column level, all pixels in each column are averaged and next the rms value is calculate on these average column values.  Once the noise for each column is known, the average of all rms values is calculated.

The result of this process is shown in Figure 1.  Both the temporal noise on pixel level (previous blog) and the temporal noise on column level are shown as a function of integration time.

next_blog_11


Figure 1. Temporal noise measured in dark on pixel level and on column level, as a function of the exposure or integration time.

As can be expected, the column level noise is much lower than the pixel level noise, although the difference between the two curves is minimum at 0 s exposure time and at saturation.  At lower exposure times, the temporal noise of the electronic circuitry plays the most important role, and because the difference between pixel and column noise is not that much, it can be expected that most of the total temporal noise in dark is coming from the column circuitry.  For larger values of the exposure time, the dark shot noise is dominant and in that case, the averaging effect on the data removes this pixelized noise component.  At saturation, the noise is reaching its minimum value.

Numbers that are obtained :

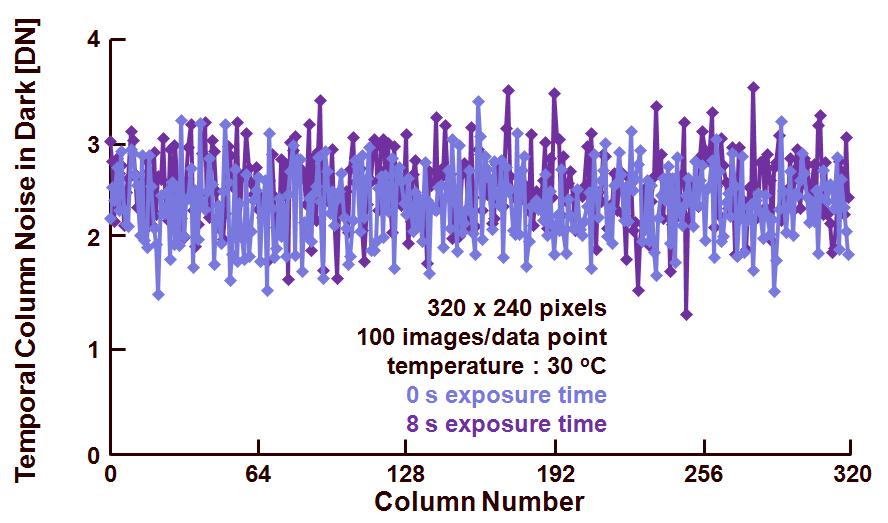
       At 0 s exposure time, the temporal noise on column level is 2.40 DN,

       At 25 % of saturation, and for an exposure time of 8 s, the temporal noise on column level is 2.66 DN.


next_blog_21

Figure 2.  Column noise in dark for two different integration times.

Figure 2 shows the column noise in dark for two integration times : 0 s (to get the noise without any dark shot noise) and at 8s (when the pixels containing 25 % of the full well capacity).  In both cases no repetitive pattern in the noise can be recognized, this is also verified by means of a FFT calculation.  The result of this is shown in Figure 3.

next_blog_3


 Figure 3.  FFT of the signal of the column noise calculated for an exposure time of 0 s.

As can be observed in Figure 3, there is no specific FFT signal available at a particular frequency.  From this, one can conclude that the column noise is randomly distributed.

Next time a similar exercise will be done for the temporal noise in dark on row level.

Albert, 27-06-2012.

CMOS Image Sensor Workshop, Duisburg, June 12-13, 2012

June 14th, 2012

Over the last two days, IMS Fraunhofer organized their bi-yearly CMOS imager workshop.  The workshop was attended by (about) 90 people I guess.  Presentations were done by invitation only.  It was already the sixth time this workshop took place, always in a very good atmosphere and always accompanied by an excellent workshop dinner on the first night.

Of course the most important part are the presentations held at the workshop.   It is impossible to comment on all of the details (because I did not take enough notes), but what I can recall from the top of my head :

– the undersigned had the honour to open the workshop with a talk on the effects of CMOS scaling versus scaling of photonics,

– two interesting presentations followed about the pinned photodiode as the heart of modern CMOS pixels.  TowerJazz gave a lot of details about the pinned diodes, its optimization in technology and in driving circuitry.  Several artifacts were illustrated and explained, like lag, noise, full well, transfer, etc.   After this presentation, Viimagic illustrated how to implement the diodes in a high-performance image sensor.  Focus was paid on CMOS pixels with a global shutter.

– from the application side, Dirk Viehmann gave an overview of solid-state imaging in space.  Many people are used to camera modules for mobile phones, but in the presentation, camera systems almost as large as a complete house were shown.  Impressing technology !

– ToF was covered in 3 talks, coming from PMD, SoftKinetic and Fraunhofer themselves.  Very nice overview of the various methods to perform depth sensing by ToF imagers.

– With respect to non-visible imaging, there were 2 presentations.  First one from Holger Vogt on uncooled microbolometers.  The second one from Jan Bosiers about wafer-scale CMOS imagers.  The bolometer paper described a technology somewhat outside the classical image configurations and technologies, but maybe just for that reason, it was very interesting.  Bosiers on his side gave a very nice overview of large area CMOS devices published recently.

– Next two presentations on optics and camera testing.  Ziv Attar got the attention of the audience by his ideas and explanation of array cameras.  Bernd Jaehne explained in his enthousiastic style the benefits of the EMVA1288 measurement standard.

– The workshop concluded with 3 presentations in the SPAD field : University of Edinburgh, Philips and Politecnico di Milano.  Robert Henderson gave a great overview of the recent published SPAD work.  Philips was focusing on implementing their specific SPAD technology into a medical product and from Politecnico the introduction of SPADs in InGaAs technology was shown.

I do realize that much and much more information was given on many more topics than listed over here.  But I just want to give my readers an idea of what happened over the last couple of days in Duisburg.

Thanks to Werner, Bedrich, Cornelia and all the others for organizing this workshop.  Looking forward to the next on in 2014 ?

Albert.

14-06-2012.

How To Measure Temporal Noise in Dark ? (1)

June 4th, 2012

A few days ago I promised to write some material about how to measure temporal noise.  Temporal noise measurements seem to be very difficult, but actually the reality is different.  Based on the fact that temporal noise is simply the variation of a particular parameter in the time domain, multiple measurements of the same pixel in combination with some simple statistical calculations can do the job !  If one has the choice, the pixel that is going to be sampled is not illuminated, otherwise the photon shot noise will be measured (and there are plenty of people who did this already before !).  Also the dark shot noise needs to be avoided, so preferably a pixel with 0 ms exposure time is analyzed.  Besides the photon shot noise and the dark shot noise, other noise components present when measuring the temporal noise are :

       Johnson noise of all resistive components,

       1/f noise of the MOS transistors (mainly the source-follower in CMOS pixels),

       kTC noise (if not cancelled by CDS),

       quantization noise of the ADC, and,

       any other noise contribution of extra electronics on-chip or off-chip.

Actually there are several ways to measure the temporal noise of an image sensor :

       After sampling a particular pixel multiple times (the more the better !) the rms value of all measurements is calculated.  This will give the noise in mV, DN or maybe even in another measurable quantity,

       The usage of a spectrum analyzer, to evaluate the temporal noise as a function of the frequency.  This type of measurement can help in localizing a particular noise source that is popping up at a specific frequency (e.g. power supply related noise),

       Once the fixed-pattern noise is known of an imager, grabbing a single image (containing temporal and fixed-pattern noise) and subtracting from it the FPN image can result in a temporal noise measurement as well,

       The photon transfer curve (with or without light as discussed in this blog).

The data or images that are going to be used in the analysis of the temporal noise are the same ones as already used in the discussion of the fixed-pattern noise.   The average dark signal as a function of the exposure or integration time is already shown in an earlier blog, here only the temporal noise in dark is shown in Figure 1.  To calculate the temporal noise the following procedure is followed :

       Grabbing 100 images in dark at various exposure times, including an exposure time of 0 s,

       Based on the 100 images obtained at every exposure time, the noise on pixel level is calculated by calculating the rms value of the 100 values available for every pixel.  In this way a noise value for every pixel is obtained,

       Finally the average value of all noise values (at every exposure time) is calculated and shown in Figure 1.  So every single data point in the figure is the result of 320 x 240 x 100 = 7.7 M pixel values.  (It is not an absolute must to include all pixels in the calculation of the temporal noise.  To avoid some “edge effects” a smaller window or region-of-interest can be used for the noise calculations.)

next_blog_1

 Figure 1. Temporal noise, measured in dark, as a function of the exposure or integration time.

From left to right the following noise effects/components can be recognized :

       For an exposure time equal to 0 s, the temporal noise is equal to 3.9 DN.  This is the absolute minimum value the noise can have, it is the contribution of all temporal noise sources excluding any photon shot noise (the measurement is done in dark anyhow), and excluding any dark-current related noise because of the chosen exposure time,

       Once the exposure time is larger than 0 s, the dark current shot noise is added, and the total noise increases.  The increase is non-linear, because the dark shot noise has a square-root relation with the dark signal (this square-root relation is only valid in the charge domain !),

       The noise reaches a maximum (23.15 DN) at the moment that the dark-current generated signal + dark current shot noise is hitting the saturation ceiling of the pixel.  At the onset of saturation, only a few pixels will saturate, but at a larger exposure time, more and more pixels will and ultimately the average noise level is going to decrease,

       Once all pixels are saturated, the temporal noise contribution of the pixel is becoming negligible.

But “There’s a warning sign on the road ahead” :

       All the images at a particular exposure time are represented in Figure 1 by means of a single number.  This can be OK for a system that can be characterized by a global measurement (such as a CCD with a single output).  But the CMOS pixels can have noise levels that differ from each other.  Any variation from pixel to pixel cannot be detected from a single number.  It should be mentioned that data sheets very often contain such a single number for the noise specification,

       Measuring noise and expressing it by means of a single number has the risk that it can be dominated by other noise sources, such as shading, fixed-pattern noise, defects,etc.

       No information is available on the type of noise,

       Dark current shot noise is strongly dependent on temperature, other noise sources change less with temperature.  Thus noise characterization needs to be done on temperature-stabilized devices.  Temperature variation should be less than 1 oC,

       Statistics on column noise and row noise can be of great importance to analyze the temporal noise of an imager.  These topics will be subject of the next blog.

During the noise calculation, the data of the temporal noise of every single pixel is present.  For that reason, it is quite simple to extract a histogram of the noise on pixel level.  The result is shown in Figure 2.


next_blog_2

Figure 2.  Temporal noise (in dark) histogram of the pixel at 0 s exposure time.

To exclude any effect of the dark-current shot noise, the histogram is based on the data obtained at 0 s exposure time.  As can be seen, the distribution has a fairly long tail.  The latter is due to 1/f noise and RTS noise in the pixels.  The main distribution, with a relative narrow and sharp needle is representing the pixels in which the dominant noise source is the Johnson noise.


Albert, 04-06-2012.

How To Measure : Status

May 29th, 2012

It has been a long time since we met, I know, but time to simulate, measure, evaluate and write is becoming more and more a problem.  Sorry about that !  Writing material for the blog is just a side project, and unfortunately has a low priority.  But on the other hand takes quite a bit of my time.  Those of you who run their own company are familiar with these kind of issues I guess.  Actually having no time to write blog stuff is probably a luxury problem …

Last week I prepared quite some data and on a short term I expect more information to come about temporal noise measurements !

Maybe some other interesting news : Harvest Imaging is going to expand.  Not in number of people, but in office space.  Till now I am running Harvest Imaging from my home office, and you should take this literally.  I do have my office in my house.  I am using all space available in the house, and sometimes even space that is not available.  To further accommodate with the growth of Harvest Imaging, new office space was urgently needed and is now acquired, about 800 meters from my home.  I attach here a picture of the apartment that will be becoming part of Harvest Imaging.  At this moment the building is still under construction, it will be ready after the Summer holidays.  Harvest Imaging will be located in the apartment under the black roof at the right hand side of the picture.  The balcony right is connected to my new office, the balcony left is connected to the measurement lab.  Once the building is ready, I can go back to my work as in the older days.

kantoor

Albert, 29-05-2012.

How raw RAW can be !

May 13th, 2012

Coming June 5th is going to be again a great day for Neil Young fans.  On that day Neil will release his new album called “Americana”.  The title is referring to the old American folk songs that he recorded on this new  album.  But the greatest news is that Neil saddled up the Horse again.  After almost 10 years of recording and playing with other musicians and bands, Neil has recorded his new album with his original band, Crazy Horse.  It is good to hear that the Horse is back
!  The pure, raw guitar rock-and-roll of the band can be heard on Neil’s website (
www.neilyoung.com) in the song “Oh Suzannah”.  Just 2 guitars, bass and drums, and there they go.  That’s the sound of Neil Young and Crazy Horse.  The song tells you how raw and simple rock-and-roll can be.

After releasing the new album I really do hope that Neil saddles up the Horse again for a tour !  To keep a horse in ideal shape, you have to frequently ride the animal !  I hope we can rely on Neil to saddle up the Horse and ride it through Europe.

The rumour is also spread that Neil is recorded a second album. It is not known whether this is with or without the Horse.  Neil is unpredictable in what is going to be the next step, and that makes it so attractive to be a fan of his music.  Thanks Neil !

Albert,
13-05-2012.