ISSCC2015 (1)

February 24th, 2015

The imaging session at this year’s ISSCC started with a presentation of A. Suzuki of Sony.  He presented a 20 Mpixel, stacked image sensor for DSC applications.  The stacked device has on the top plane the imaging part, being 2×2 shared pixels of 1.43 um pitch.  Also included on the top layer of silicon are the column electronics.  The end/output of the column circuits are connected to the second layer of silicon by vias.  This is the same concept as presented on last year’s ISSCC.  Half of the column signals is transferred to the second silicon level at the top of the sensor, the other half of the column signals is transferred to the second silicon level at the bottom of the sensor.  The author did not reveal information about via pitch.

New is the DOUBLE single-slope ADC for every column, located on the second layer of silicon.  So every pixel can be converted into the digital domain twice and in parallel, resulting in a double sampling of the data.  If the timing of the ADCs is done right, a gain of 3 dB can be realized (= to the theoretical calculation).  In this configuration of multiple sampling, the resulting noise level is 1.3 electrons for a gain of 27 dB.  But the double column-ADC can also be used in other configurations.  For instance for high-speed applications.  Instead of feeding to the two ADCs the same signal, one can also offer two different signals to the ADCs and in this way increasing the overall speed of the sensor.  This feature can be attractive for slow-motion applications.  Numbers quoted : 120 fps at 16 Mpix resolution (10 bits with on-chip data compression), 240 fps at 4 Mpix resolution (10 bits) and 960 fps at 0.7 Mpix resolution (10 bits).  For still applications, one can use the sensor with 20 Mpix resolution, 12 btis and a frame rate of 30 fps.

The final application of the dual ADC for each column is a combined of video and still capture.  While shooting the video at higher frame rates using the first ADC for each column, one can grab a single still image at full resolution using the second ADC for each column.

Some more numbers : sensor technology 90 nm 1P4M BSI, logic technology 65 nm 1P7M with 1.7 Mlogic gates on the second silicon level.  Number of pixels 5256 (H) x 3934 (V), 1/1.7 inch, full well 9700 electrons, conversion gain 76.6 uV/e, dynamic range 72 dB at 12 bits.

Albert, 24/2/2015.
How to Measure Modulation Transfer Function (10)

January 12th, 2015

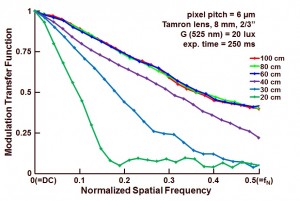
Based on one of the comments/questions of the readers of my blog, the MTF of a camera is characterized as a function of the distance between the “target” and the camera.  Again the slanted edge method was used, the light input was a green LED (525 nm), F5.6, Tamron fixed focus lens f = 8 mm.

Figure 1 shows the obtained results.

Figure 1 : MTF as a function of the distance between the test target and the camera (Tamron 8mm lens, 2/3”, F5.6).

As can be seen from the graph, distances of 60 cm and larger, give the best results as well as consistent results.  A distance of 40 cm gives already a lower MTF compared to the larger distances, but for 30 cm and 20 cm the MTF is drastically reduced.

The reason for this fall-off in MTF is twofold :

  • Below 30 cm distance between object and lens, the focusing capability of the lens is limited, and the image is becoming blurry (= less contrast and lower MTF),
  • Between 60 cm and 30 cm the reduction in MTF can be explained by the fact that the incoming rays deviated more and more from the normal, and optical as well as electrical cross-talk will become larger.  As a result the MTF is reduced.


Albert, 12-01-2015.

Merry Christmas and a Happy New Year

December 19th, 2014

Good Bye 2014 ! 

Another year has almost passed.  Time is running fast, extremely fast.  Time again to make a quick look backwards to see what 2014 brought. 

It was a busy year for Harvest Imaging.  Several courses were organized, in-house as well as public courses.  Thanks to CEI, FSRM and Framos who organize the public or open courses.  Thanks to all my customers for the in-house courses.   The in-house trainings brought me again all over the world.  Several courses are scheduled again in 2015.  The open courses are listed on the website of Harvest Imaging.  Besides the trainings, also consulting went pretty well in 2014.  I could keep myself more than busy. 

In 2013 Harvest Imaging started with a forum, being a kind of 2-day class in a field of solid-state imaging, but outside my own expertise.  The first forum was very successful so that it was decided to run another one in 2014.  That just happened last week and earlier this week.  Many positive reactions were received, so the forum will continue in 2015.

It is quite funny to meet people all over the place telling me that they follow my blog.  I am very pleased with these reactions, and sometimes I am really surprised to see how many people visit the website every day.  Thanks very much for your visits and for your feedback.  It is very much appreciated.  Unfortunately there is something that I am missing to put more material on the blog, and that is time.  About two years ago, at the moment that I posted a blog, I had already 3 of 4 extra blogs ready to be published on a later stage.  But at this moment, the pace of blogging is equal to the pace of writing down the material.  In 2014 several blogs were spent on the MTF or Modulation Transfer Function.  I think I never received that many reactions as this time with the MTF.  Apparently it is a subject that “lives” in the community.  A few more blogs about the MTF will follow and then it is over. 

2015 will be a year to have the International Image Sensor Workshop again in Europe.  Being the General (Co-)Chair of the workshop, preparations have already started a while ago  Together with Johannes Solhuvik and Pierre Magnan, we try to make sure that IISW2015 will be another workshop to remember.  Of course much is depending on the quality of the submissions, but Johannes, Pierre and myself will make sure that the setting to present your work will be the most optimum we can obtain.  Besides being the co-chair for the workshop I accepted another task, being the Guest-Editor for the upcoming special Image Sensor issue of IEEE Transactions on Electron Devices.  For both “events”, workshop and special issue, the call for papers is already published.

Recently I was lucky to receive the SEMI Award, but another award, even the real Emmy Award was received for the broadcast camera that was developed around one of the CCDs developed at the time I headed the CCD group at Philips.  That is really a great recognition for the CCD team working at that time on the DPM-CCD.  The concept of a switchable pixel was developed in a close cooperation between the camera developers and the sensor designers, leading to a very nice commercial success.  Congratulations to all people who contributed to this success.

In other words, also 2015 will be busy again.  Nevertheless : Welcome 2015 !  Wishing all my readers a Merry Christmas and a Happy New Year. 

Albert, 19-12-2014.

How to Measure Modulation Transfer Function (9)

November 14th, 2014

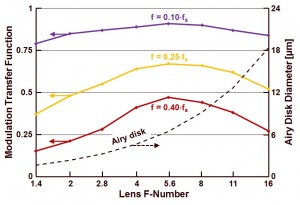
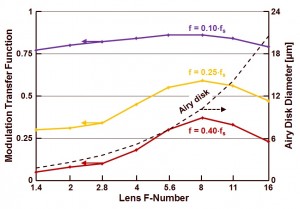
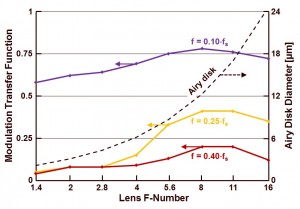
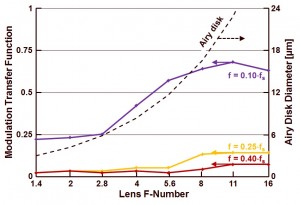
Last time the MTF results obtained with green light (525 nm) were highlighted.  This time those results are compared with the MTF measurements done with blue light (470 nm), red light (630 nm) and near-IR light (850 nm).  To compare the results, the measured MTF is shown as a function of the F-number of the lens, and at 3 different spatial frequencies : 0.1, 0.25 and 0.4 times the spatial sampling frequency.  Figures 1, 2, 3 and 4 illustrate the outcome of the measurements, respectively for the blue, green, red and near-IR light.  All results reported come from the same sensor, same camera, same lens (Tamron, 8mm) and same measurement set-up.  All four figures also illustrate the size of the Airy disk as a function of the lens F-number (second vertical axis).

Figure 1 : MTF as a function of lens F-number at 0.1, 0.25 and 0.4 times the sampling frequency, measurements done with blue light input (470 nm).

From figure 1 it can be learned that the optimum setting of the lens F-number is equal to F5.6.  At F16 the Airy disk is equal to 3 times the pixel pitch, and this large size of the blurred spot limits the MTF at the high F-numbers.

Figure 2 : MTF as a function of lens F-number at 0.1, 0.25 and 0.4 times the sampling frequency, measurements done with green light input (525 nm).

Changing the light from blue to green shifts the optimum setting of the lens F-number to F8.  This seems to be in contradiction to what can be expected from the diffraction limits of the lens, because the size of the Airy disk has grown to about 3.5 times the pixel pitch for F16, it would be expected that the optimum setting for the F-number would shift to a lower F-number in comparison to the measurement shown in Figure 1.

Figure 3 : MTF as a function of lens F-number at 0.1, 0.25 and 0.4 times the sampling frequency, measurements done with red light input (630 nm).

The “sweet spot” for the lens setting shifted slightly to have an optimum between F8 and F11, despite of a further growth of the Airy diameter.  So the trend of shifting to larger F-numbers when also the wavelength of the light is increasing, seems to be consistent, even if the diffraction is increasing.

Figure 4 : MTF as a function of lens F-number at 0.1, 0.25 and 0.4 times the sampling frequency, measurements done with near-IR light input (850 nm).

Not visible is the Airy disk diameter at F16, being equal to more than 5.5 times the pixel pitch.  So at the highest F-number, the MTF absolutely will be limited by the diffraction of the lens, but nevertheless the best MTF values are still measured around F11.

As already mentioned in the previous blog, the MTF of the camera system (= lens + sensor + processing) is mainly determined by 3 factors :

  • Diffraction of the lens, being a strong function of the F-number and which is worst for F16 and best for F1.4,
  • Aberrations of the lens, being worst for the lowest F-numbers,
  • Cross talk in the pixels (optical as well as electrical), expected to be worst for the lowest F-numbers as well, because for these settings of the lens, the angle under which the rays hit the sensor deviate the most from the normal.

The major observation of shifting the optimum lens F-number (for MTF performance) to larger F-values, despite of the increasing wavelengths, indicates that cross-talk contribution to the deterioration of the MTF is a major factor for lower F-numbers.  The MTF drop is remarkable in the case the F-number is kept constant but the wavelength of the light source is changed.  So the wavelength of the light has a major influence, the latter is due to the lower absorption coefficient of the silicon for these longer wavelengths.

As a general conclusion : the MTF of the device-under-test is seriously suffering from cross-talk between the pixels, in particular when the light is coming under angles that deviate more from the normal (= low F-numbers) and/or when the light can penetrate deeper into the silicon (= longer wavelengths).

Albert, 14-11-2014.

How to Measure Modulation Transfer Function (8)

October 28th, 2014

Now that we know how to apply the slanted edge method, it is time to play around with it and gather some interesting results.

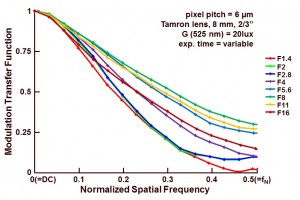
The camera under test is provided with a special lens that has a variable iris setting with a click system, so that it is becoming easy to define and change the F-number of the lens during the measurements. Using a green LED light source with a wavelength of 525 nm, a set of MTF measurements is made at various settings of the F-number. The result is shown in Figure 1.

Figure 1 : MTF measurement for green light, as a function of the F-number of the lens.

While changing the F-number, the exposure time setting of the camera is optimized so that a constant output signal is obtained. For every change of one F-stop, the exposure time is adapted by a factor of 2. As can be seen from Figure 1, starting with a low F-number and moving towards higher values, the MTF increases from F1.4 till F8 and then starts decreasing again till F16. This effect of increase and decrease can be explained by the interaction of three effects :

– Most lens aberrations are becoming worse for lower F-numbers. So changing the lens setting from a low F-number to a larger F-number will decrease the lens aberrations and will increase the sharpness of the image projected on the sensor. Consequently, the MTF will increase,

– Low F-numbers result in larger angles under which the rays are hitting the sensor. If the angle of the incoming rays deviates more from the normal, the chance of generating optical and electrical cross talk is becoming larger. So higher F-numbers result in less cross-talk and better MTF,

– Even with a perfect lens, a point at the object plane will result in a disk at the image plane. This so-called Airy disk has a diameter equal to 2.44xlxF, in which l represents the wavelength of the incoming light. Taking into account a pixel size of 6 um and a wavelength of 0.525 um, the size of the Airy disk is becoming equal to pixel pitch for F4.7, the size of the Airy disk is becoming equal to 2 times the pixel pitch for F=9.4, the size of the Airy disk is becoming equal to 3 times the pixel pitch for F14.1. So if the F-number is becoming larger, the spot size is becoming larger as well and the image at the sensor level is becoming more blurred. This effect is making the MTF lower, which can be observed for a F8 and higher.

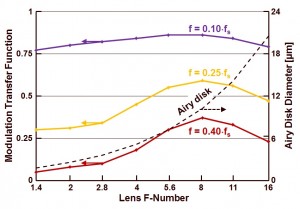
The dependency on the F-number is better observable in Figure 2, which illustrates the MTF at 3 different values of the spatial frequency (10 %, 25 % and 40 % of the sampling frequency).

Figure 2 : MTF as a function of the F-number for 3 different spatial frequencies : 10 %, 25 % and 40 % of the sampling frequency, and Airy disk size as a function of F-number.

Also the size of the Airy disk as a function of the lens F-number is shown, referring to the right vertical axis. As can be seen, for green light F8 seems to be the optimum setting of the lens as far as MTF of the camera system is concerned.   More on this topic next time !

Albert, 28-10-2014.

How to Measure Modulation Transfer Function (7)

October 6th, 2014

In the meantime there should be enough explanation about the slanted edge method in this blog, it is time now to do the measurements.  For those of you who want to get quick results with the slanted edge method, you can follow the rules/guidelines/advices of the ISO-12233 standard, buy the testchart, install the software, and get going.  Of course, it is much more fun to develop the whole stuff yourself, and by the way, that is the proper way to learn all the details about the slanted edge method for the MTF characterization.

So now the first measurement results of the slanted edge method will be highlighted.  The various steps to come to the appropriate results go as follows :

  • Focus an object/target with a slanted edge  (preferably between 2o and 10o) on the imager,
  • Grab 50 images of the slanted edge object and average these images to lower the temporal noise,
  • Grab 50 images of a uniform target (without changing the camera settings, without changing the light source) and average these images to lower the temporal noise,
  • Grab 50 images in dark (without changing the camera settings) and average these images to lower the temporal noise,
  • Correct the slanted image data for non-uniformities in dark and for non-uniformities in pixel response and/or non-uniformities of the light source,
  • Select a smaller window of the image in which the slanted edge is present,
  • Calculate the slope of the slanted edge w.r.t. the vertical column or horizontal row direction of the imager, the slope of the slanted edge is needed to calibrate/normalize the horizontal spatial frequency axis of the MTF curve,
  • Record the spatial frequency response (SFR) in 4 adjacent columns, merge the 4 SFR’s and perform a further data interpolation, to get equidistant data point in the spatial domain,
  • Calculate the line-spread function (LSF) based on the 4-times oversampled SFR,
  • Force the LSF through a fast-Fourier transform, resulting in the optical transfer function and calculate the magnitude of the latter to obtain the modulation transfer function,
  • Normalize both axes to get the classical MTF curve.

Figure 1 shows some intermediate steps of the MTF characterization.  The left part of figure 1 illustrates the observed slanted edge, in a window of 100H x 350V pixels.  The slanted edge is created by means of the edge of a MacBeth chart in front of a white sheet of paper.  The middle part of figure 1 shows a randomly chosen horizontal line (in red) along which the dark-light transition is checked.  Through this dark-light transition the pixels values along a vertical column (in green) are used for the SFR measurement.  Finally, the right part of figure 1 shows the calculated slanted edge (in blue).

Figure 1 : Three illustrations of the observed slanted edge : left the raw data coming off the sensor, middle : row and column along which the SFR is measured, right : the slanted edge as calculated by the software tool.

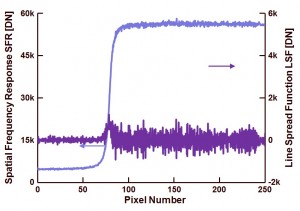
Figure 2 shows the SFR and LSF based on the pixels values shown in figure 1 and after 4 times oversampling of the data (= using the data of 4 adjacent columns).

Figure 2 : Spatial Frequency Response after 4x oversampling.

As can be seen by means of the SFR on figure 2, the transition from dark (left side) to light (right side) is relatively steep, but this steepness is much less visible in the LSF in figure 2.  The latter has to do with the 4x oversampling, which reduces the difference between two neighbouring measurement points.   Also remarkable is the relative large variation in the white background used in the measurement.  But these variations show up at a relative high frequency and will not influence the MTF measurement.

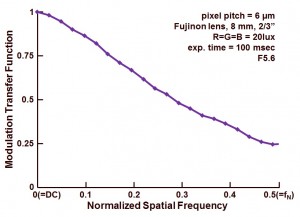
The final MTF result is show in Figure 3.


Figure 3 : MTF obtained by the slanted edge method.

The measurment with white light (R=G=B) results in an MTF of 0.25 or 25 % at Nyquist frequency.  For a pixel with a large fill factor  (the exact value is not known, but the pixel pitch is large and with micro-lenses, a large fill factor can be expected) this number of 0.25 or 25 % is relatively low.  It should be noted that not just the sensor MTF is measured, but the measurement does include the camera lens as well !

Albert, 06-10-2014.

Special Issue of IEEE-ED on Solid-State Image Sensors

September 3rd, 2014

Call for Papers for a Special Issue of

IEEE Transactions on Electron Devices on

Solid-State Image Sensors


In recent years there have been enormous advances in solid-state image sensors in CMOS (CIS).  Improvements in pixel density, quantum efficiency, power dissipation, temporal noise, fixed-pattern noise are just some of the advancements that are permitting the widespread adoption of image acquisition in consumer appliances such as personal digital assistants, digital still cameras, camcorders, cell phone handsets as well as in automotive, industrial, medical and scientific applications.  This special issue will provide a focal point for reporting these advancements in an archival journal and serve as an educational tool for the solid-state image sensor community.  Previous special issues on solid-state image sensors were published in 1976, 1985, 1991, 1997, 2003 and 2009.


Areas of interest include, but are not limited to:


  1. Pixel device physics (New devices and structures, Advanced materials, Improved models and scaling, Advanced pixel circuits, Performance enhancement for QE, Dark current, Noise, Charge Multiplication Devices, etc.)
  2. Image sensor design and performance (New architectures, Small pixels and Large format arrays, High dynamic range, 3D range capture, Low voltage, Low power, High frame rate readout, Scientific-grade, Single-Photon Sensitivity)
  3. Image-sensor-specific peripheral circuits (ADCs and readout electronics, Color and image processing, Smart sensors and computational sensors, System on a chip)
  4. Non-visible “image” sensors (Enhanced spectral response  e.g., UV, NIR, High energy photon and particle detectors e.g., electrons, X-rays, Ions, Hybrid detectors, THz imagers)
  5. Fabrication, packaging and manufacturing (stacked image sensors, back-side illuminated devices)
  6. Miscellaneous topics related to image sensor technology


    Submission Deadline:  February 28th, 2015

    Targeted Publication Date: January 2016


    Guest Editor-in-Chief:

    Prof. dr. Albert Theuwissen, Harvest Imaging, Bree, Belgium, and Delft University of Technology, Delft, the Netherlands.


    Guest Editors:

    Prof. dr. Eric Fossum, Thayer School of Engineering, Dartmouth, NH, USA,

    Dr. Boyd Fowler, Google, Mountain View, CA, USA,

    Prof. dr. Shoji Kawahito, Shizuoka University, Shizuoka, Japan,

    Prof. dr. Pierre Magnan, ISAE, Toulouse, France,

    Dr. Junichi Nakamura, Brillnics, Tokyo, Japan,

    Dr. Johannes Solhusvik, Omnivision, Oslo, Norway,

    Prof. Nobukazu Teranishi, University of Hyogo, Japan, and Shizuoka Univeristy, Japan,

    Dr. John Tower, SRI International, Princeton, NJ, USA.


     Please submit papers by using the website : http:/mc.manuscriptcentral.com/ted , be sure to mention the special issue within the cover letter.

Forum on Advanced Digital Image Processing : update

August 30th, 2014

I would like to give you a quick update of the forum status.  The first session is sold out, but for the second session, there are still some seats available.

For those who are interested, you can find all information at www.harvestimaging.com/forum.php

Albert, 30-08-2014.

How to Measure Modulation Transfer Function (6)

August 4th, 2014

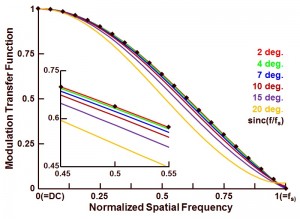
Previous time it was explained that larger angles of the slanting edge may result in deviating MTF values.  The results already presented in the previous post is repeated here in Figure 1.

 Figure 1 : Effect of the slanted edge angle on the accuracy of the evaluation technique to characterize the MTF.

As a message from the simulation results shown in Figure 1 : angles of the slanted edge between 2 deg. and 10 deg. are very well suited for the MTF analysis.  This can be seen by checking their comparison to the ideal curve (see black dots in Figure 1).  Once the angle is larger than 10 deg., the slanted edge method starts loosing accuracy.  The simulation results obtained here are fully in line with the advices of the ISO standard, which suggests also to use an angle of the slanted edge between 2 deg. and 10 deg.  Just to highlight the deviations, an extra insert is included in Figure 1 to shown the MTF behaviour around the Nyquist frequency.

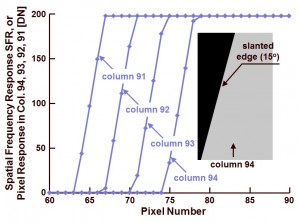
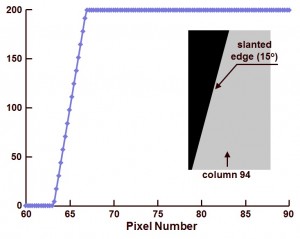
One of the reasons why angles larger than 10 deg. give deviating results is the fact that the number of measurement points in a particular sensor column is getting smaller and smaller if the angle is getting larger.  This can indeed result in nasty effects on the MTF values and can lead to aliasing effects in the sampling of the data.  To avoid these type of issues, it is possible to take the data of multiple columns into account instead of using the data of just a single column.  To show the overall working principle of oversampling, the spatial frequency responses (SFR) of 4 neighbouring columns are shown before (Figure 2) and after (Figure 3) multiplexing the data into a single SFR.

 Figure 2 : Spatial Frequency Response of 4 neighbouring columns.

Figure 2 shows the data collected in 4 neighbouring columns, respectively columns 94, 93, 92 and 91, running vertically and crossing the slanted edge (which has an angle of 15 deg.).  Four SFRs are obtained, all with a relative low amount of data points.  As illustrated in Figure 3, the amount of data points can be increased by means of multiplexing the 4 curves of Figure 2 into one single SFR with 4 times the amount of samples.


Figure 3 : Spatial Frequency Response of the 4-times oversampled data, after multiplexing the 4 curves shown in Figure 2.

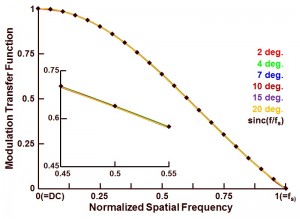
Based on this method of 4-times oversampling (also recommended by ISO 12233), the accuracy of the MTF measurement as a function of the angle of the slanted edge is checked again.  The results of this exercise are shown in Figure 4.


Figure 4 : Effect of the slanted edge angle on the accuracy of the evaluation technique to characterize the MTF, based on a 4-times oversampling of the SFR data.

The result is quite remarkable : up to an angle of 20 deg. no deviation between the various obtained MTF curves can be seen, even not in the insert showing the MTF around the Nyquist frequency.

So oversampling when obtaining the SFR is absolutely recommendable, because it results in more data points to generate the SFR.  And in the simulation result described in this and previous blogs, the “measured” modulation transfer function does not deviate from the theoretical one.

Albert, 01-08-2014.

Additional Session for the Solid-State Imaging Forum

July 25th, 2014

Is it the subject of the forum that makes the forum appealing, or is it the speaker that attracts the attention ?  Actually the answer to this question it not that important, I just want to mention that the first session of the forum is nearly sold out, and that is a good reason to organize a second session.  Same location, same speaker, same content, only a different date of course.  The second session is scheduled for DECEMBER 15TH AND 16TH, 2014.

More information can be found on www.harvestimaging.com/forum.php

Albert, 25-7-2014.