Now that we know how to apply the slanted edge method, it is time to play around with it and gather some interesting results.
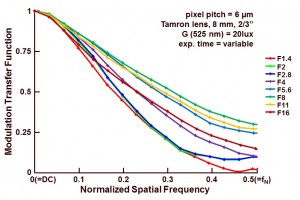
The camera under test is provided with a special lens that has a variable iris setting with a click system, so that it is becoming easy to define and change the F-number of the lens during the measurements. Using a green LED light source with a wavelength of 525 nm, a set of MTF measurements is made at various settings of the F-number. The result is shown in Figure 1.
Figure 1 : MTF measurement for green light, as a function of the F-number of the lens.
While changing the F-number, the exposure time setting of the camera is optimized so that a constant output signal is obtained. For every change of one F-stop, the exposure time is adapted by a factor of 2. As can be seen from Figure 1, starting with a low F-number and moving towards higher values, the MTF increases from F1.4 till F8 and then starts decreasing again till F16. This effect of increase and decrease can be explained by the interaction of three effects :
– Most lens aberrations are becoming worse for lower F-numbers. So changing the lens setting from a low F-number to a larger F-number will decrease the lens aberrations and will increase the sharpness of the image projected on the sensor. Consequently, the MTF will increase,
– Low F-numbers result in larger angles under which the rays are hitting the sensor. If the angle of the incoming rays deviates more from the normal, the chance of generating optical and electrical cross talk is becoming larger. So higher F-numbers result in less cross-talk and better MTF,
– Even with a perfect lens, a point at the object plane will result in a disk at the image plane. This so-called Airy disk has a diameter equal to 2.44xlxF, in which l represents the wavelength of the incoming light. Taking into account a pixel size of 6 um and a wavelength of 0.525 um, the size of the Airy disk is becoming equal to pixel pitch for F4.7, the size of the Airy disk is becoming equal to 2 times the pixel pitch for F=9.4, the size of the Airy disk is becoming equal to 3 times the pixel pitch for F14.1. So if the F-number is becoming larger, the spot size is becoming larger as well and the image at the sensor level is becoming more blurred. This effect is making the MTF lower, which can be observed for a F8 and higher.
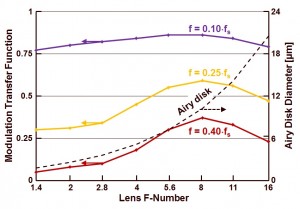
The dependency on the F-number is better observable in Figure 2, which illustrates the MTF at 3 different values of the spatial frequency (10 %, 25 % and 40 % of the sampling frequency).
Figure 2 : MTF as a function of the F-number for 3 different spatial frequencies : 10 %, 25 % and 40 % of the sampling frequency, and Airy disk size as a function of F-number.
Also the size of the Airy disk as a function of the lens F-number is shown, referring to the right vertical axis. As can be seen, for green light F8 seems to be the optimum setting of the lens as far as MTF of the camera system is concerned. More on this topic next time !
Albert, 28-10-2014.


I noticed you did not include the MTF roll-off caused by the pixel aperture size, normally 80-90% of the pixel pitch (Which I presume is square in your calculations).
It is just sample theory. I believe you just forgot it. many people involve in optics usually forget this point because they are usually focused on the optics performance only.
As in most technical disciplines where sampling is involve the solution is to add sharpening to help mitigate the roll off caused by sampling. I am not sure if there is a sharpening setting on your DSLR, so it is important to point that out. For spatial sharpening in pictures we have the human visual system involve in choosing a good choice. Too much sharpening will clip edges white and too little will not make good pictures.
I am just trying to help for a future article. I hope you will take it that way.
Many thanks for a very good and nicely done article above.
Tom
Hi Tom, thanks for the comment. But this is a MEASUREMENT, and does include all parts of the optics as well as the sensor. So nothing about the optics and/or sensor is forgotten. The data on which the results are based, is raw data coming right off the sensor. So no processing is involved.
Thanks for your blog, well worth reading.
The MTF is the real part of the truth, so to speak. The full truth is contained in the point spread function, although of course it is not as easy to quantify performance in terms of PSF. The PSF is still of interest in my field of spectral imaging, for characterization of band coregistration and spectral mixing behaviour, and surely also of interest elsewhere? Do you have opinions on how to best measure the PSF? For our part we have resorted to reconstructing it tomographically from slanted slit scans (see proc SPIE DSS this year) but for all I know there may be more efficient ways to do it?
Hi Albert,
How did you focus and what was the distance to the chart?
Dear Albert,
Thanks for your blog. Very useful indeed! In this text you say that the optimum Airy disk size comes from a F/4.7 aperture for a 6um pixel pitch and it gets worse with the increase of the f-number. I wonder why a F/5.6 has worse MTF figures than a F/8 aperture.
Best wishes
Luiz
Hi Luiz, from the standpoint of Airy disk/diffraction you would except F5.6 to be better in MTF than F8, but the cross-talk in the situation of F5.6 is worse compared to the situation of F8. The lensopening is larger for F5.6, so the ray enter the sensor under larger angles, introducing more cross-talk. In my next blog I will come back to this issue more extensively. Albert.
Hi Herve, the focusing was done manually by adjusting the lens such that I got the steepest black-white transition at the slanted edge. The image-grabbing software I use allows me to look at the pixel values along a particular line and shows the profile (= pixel values) on the PC screen during focusing. The distance between the target and the camera is about 70 cm. Please notice that the window in which the MTF is calculated is only a small window out of the complete image, and is situated close to the optical axis of the system.
You raise an interesting point about distance to the test target. I will do an exercise on this in one of the coming blogs. Next time I will talk about a bit more about cross-talk, diffraction and lens aberrations. I also will do an extra measurement with near IR light. So much more to come.
Hi Torbjorn, thanks for the reaction on my blog. Unfortunately I cannot give you that much more information w.r.t. PSF. In the past (=mid ’90s) we tried to get an idea about PSF by means of a spot illumination on the sensor. It took us a huge amount of effort to create an optical beam with a diameter of about 1 um. This set-up allowed us to measure the MTF of the pixels, as well as the spread of the QE within a pixel. I do not recall whether we were able to get a better idea about the PSF. The measurements I am referring to were done by a co-worker. If you want I can try to find out more, but the chance on success will be small I guess.
Hi Albert,
This behavior is typical of photography lenses: at wide aperture, the lens aberrations are predominant, stopping down reduces them and MTF increases up to a point that the lens is “diffraction limited”, then stopping down reduces the MTF due to diffraction. An astronomy optics should behave differently since it is designed to be diffraction limited on axis at full aperture.
So one caveat is that the “best focus” position (which would require a precise definition) at one aperture might not be the best focus position for another one. If you feel like experimenting, measuring the “through focus” MTF is quite instructive.
Another fascinating method is the Roddier test that can measure all the lens aberrations from 2 largely defocused images.
70cm is a reasonable distance in my opinion, I’d expect a lower MTF at short distances (macro).
Thanks Herve, I do appreciate your comments.