How To Measure The Dark Shading ?

November 24th, 2011


From the measurements of the row FPN and the column FPN, it was learned that the device-under-test (DUT) has a large shading component in dark.  (Shading refers to a gradual change of a particular parameter from top to bottom and/or from left to right.)  So it will be a very valuable exercise to measure this shading component.

To evaluate the dark shading, the same images are used as before : multiple dark images taken at room temperature and at different integration times.  To quantify the dark shading, the images taken at an exposure time of 8 seconds are used : at 8 seconds, the average dark signal is about 25 % of the saturation level.  Because dark shading is the low frequency variation of the dark signal, the following procedure is followed :

       all images captured at 8 seconds integration time are averaged, in this way the temporal noise will be reduced,

       the averaged image will be forced through a low-pass filter with a 9×9 filter kernel.  This operation will reduce the (high-frequency) FPN.

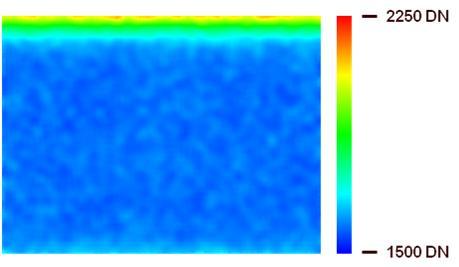
The result after averaging and filtering is shown in figure 1.

111125_blog_12

 Figure 1 : low-frequency variation in dark signal at 8 second integration time.

Clearly visible in figure 1 is the non-uniformity of the dark signal.  Its value is slightly increasing towards the lower side of the sensor, but it is strongly increasing towards the top side of the sensor.  From left to right the dark signal seems to be more constant.  This result is in full agreement with the column FPN and row FPN calculated in an earlier blog.  Those results indicated already a large variation in average row value, while the average column value was nearly constant.

The shading illustrated in figure 1 can be expressed as :

       the peak to peak value, equal to 561 DN,

       maximum-minimum value, equal to 2116 DN and 1555 DN respectively.

In principle these numbers are more or less meaningless without any further “reference”.  The additional parameters needed are :

       evaluation temperature, being room temperature,

       integration time, being 8 seconds,

       dark signal offset, being 819 DN,

       average dark signal in dark without offset correction, being 1637 DN,

       average dark signal in dark with offset correction, being 818 DN.

Comparing these numbers one can state that the dark signal shading is pretty large compared to the average signal in dark.  This can have some very annoying consequences : dark reference lines/columns are always located next to the active pixels.  So these references lines and columns can be situated in part of the sensor where the dark signal is deviating quite a bit from the average dark signal and/or the average dark signal in the center part of the sensor.  In this way the dark reference signal generated by the signal processing will be too high, and image details in dark might get lost ! 

In the case of such a large dark shading with possible issues with the dark reference lines, another way of creating a black reference is needed :

       or using black reference columns with the risk of generating row-wise noise,

       or using a black reference frame and perform a dark compensation on pixel level.

Success !

Albert, 23-11-2011.

Hands-On Characterization course in Dresden

November 16th, 2011


This week CEI organized another session of my Hands-On Characterization course in Dresden.  A new group of enthousiastic engineers registered for the course.  As could be expected the course is improving time after time.  The feedback from the participants again was very positive, and that is a strong encouragement to continue in the same direction.  This means further improvement of the course where necessary, and adding new measurement assignments to the course.  New and additional equipment is already ordered to keep the course up to date !

Almost all of the participants succeeded in finding/measuring/calculating the conversion gain of the test-camera.  Personally I do see this as the highlight of the course.  That so many participants came to right value is a remarkable success, because it is not a really simple measurement to do.  Making a Photon-Transfer Curve (PTC) seems to be fairly simple if you have some experience, but can be difficult if you have to do this for the first time.  But once the participants have the knowledge of how to create a PTC, other measurements become simple as well.  In many cases it is a matter of calculating averages and calculating standard deviations.  It is just a matter of doing this things in the right order !

At this moment my Hands-On Characterization course is only organized by CEI.  And up to now CEI is using 4 different course location : Barcelona, Copenhagen, Dresden and Cambridge.  Unfortunately the transport of the equipment needed in the course is not so easy.  Transporting by a courier is tricky because the equipment is pretty vulnerable, and tranporting by car (as I did up to now) takes a lot of time.  For that reason CEI will organize the next Hands-On Characterization course in Amsterdam (in May 2012).  This is much closer to my home, which makes the transport of the equipment much easier.  Moreover, Amsterdam is also very easy to reach from all over Europe, making the travelling for the participants very smooth as well.  Looking forward to see some of my readers in Amsterdam 😉

Albert, 16-11-2011.

How to Measure the Fixed-Pattern Noise in Dark (3)

November 1st, 2011


Column FPN was the subject of the previous blog, so it will not be any surprise that this time the row FPN will be discussed.  To calculate (!) the row FPN in dark, the same data or images as before are being used.  The following procedure is followed :

       After removing/correcting the defect pixels, all images taken at a particular exposure time are averaged on pixel level, resulting in one (average) image per exposure time,

       Next, per row all pixels are being averaged, yielding an average value for every row (at every value of the exposure time),

       Once the row averages are available, the standard deviation on these average row values is calculated.  In principle a single number will be found for all measurements done at every exposure time.

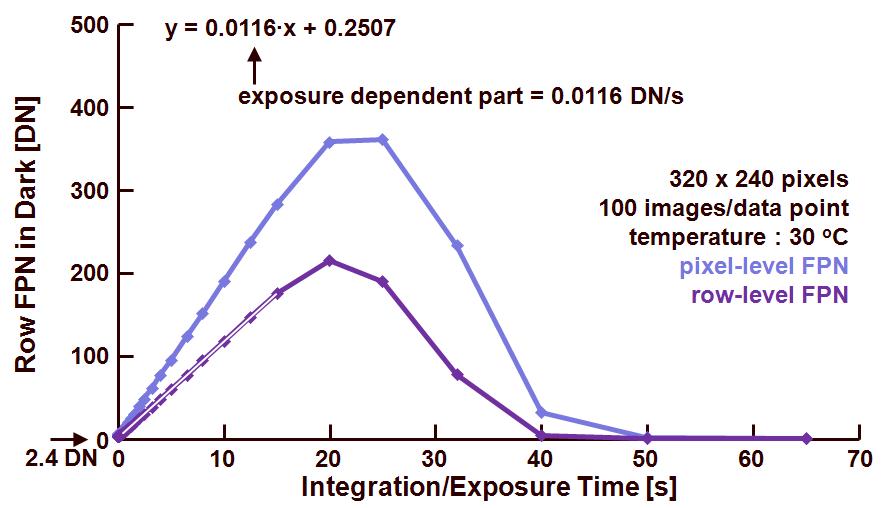
The result of this calculation is shown in figure 1, indicating the row FPN in dark as a function of exposure time.

111025_blog_1

 Figure 1 : row fixed-pattern noise in dark as a function of the exposure time.

There are two curves shown :

       the first represents the pixel-level FPN, already discussed in a previous blog,

       the second one is showing the row FPN in dark, which is only a bit lower than the pixel FPN.  The following data can be obtained from the curve : 2.4 DN is the row FPN at 0 s exposure time, and the time depending part of the row FPN equals to 0.0116 DN/s.  At 25 % of saturation level or an exposure time of 8s, the row FPN is equal to 93 DN rms.  Taking into account the absolute values mentioned earlier, the row FPN can be calculated to be equal to 5.7 % at 25 % of saturation.

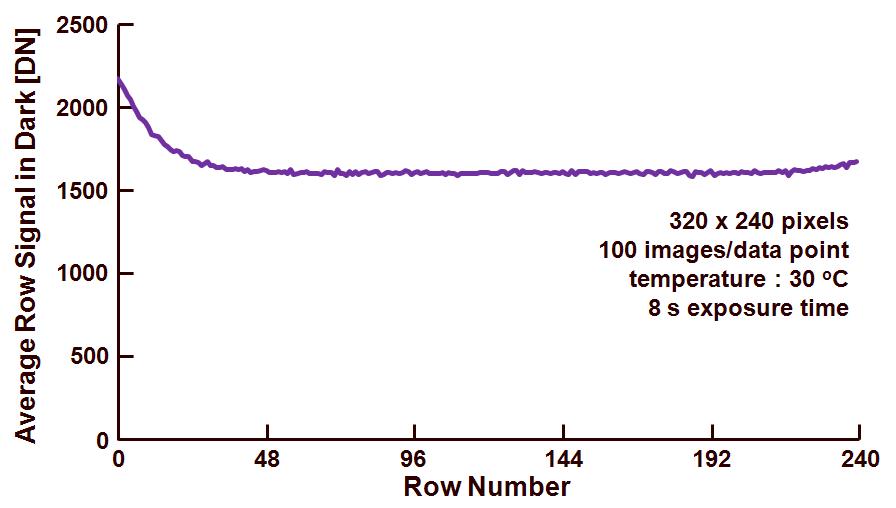
The ratio between the DSNU on pixel level and the row FPN is equal to : 0.0188/0.0116 = 1.6, whereas the theoretical value would predict : (number of columns)0.5 = 17.9.  To find out where this large discrepancy (more than a factor of 10 !) is coming from, the uniformity of the average row value of every row is checked at a particular exposure time (8 s).  The result is shown in Figure 2.

111025_blog_2

 Figure 2 : average row signal in dark at 8 s exposure time.

As can be learned from the data in Figure 2, the average row value is absolutely not constant (also expressed by the high row FPN rms value).  The figure clearly shows a large shading component in the average dark signal.  This is the origin of the large row FPN and the fact that the ratio of pixel FPN over the row FPN does not follow the theoretical value. 

Of course the large value for the row FPN is indicating a large non-uniformity of the average dark values on row level.  But the origin of this non-uniformity does not necessarily need to be found in the row circuitry, the origin is coming from somewhere else.  That will be the subject of next blog.

Albert, 01-11-2011.

How To Measure the Fixed-Pattern Noise in Dark (2)

October 11th, 2011


In the previous blog we found that the pixel FPN in dark was equal to 18.4 % of the average signal at 25 % of saturation (corresponding to 8 s exposure time at 30 deg.C).  These relative values can be translated in absolute values : rms value of DSNU is equal to 150.5 DN, while the average signal in dark is 1637 DN, the offset (in dark) being equal to 819 DN and saturation defined at 4095 DN.  (In the previous blog the DSNU was not correctly calculated.)  “Where is this DSNU coming from ?”  is a more than valid question.  In this blog we will analyze the column FPN.

To calculate (!) the column FPN in dark, the same data or images as before are being used.  The following procedure is followed :

       After removing/correcting the defect pixels, all images taken at a particular exposure time are averaged on pixel level, resulting in one (average) image per exposure time,

       Next, per column all pixels are being averaged, yielding an average value for every column (at every value for the exposure time),

       Once the column averages are available, the standard deviation on the average column values is calculated.  In principle a single number will be found for all measurements done at every exposure time.

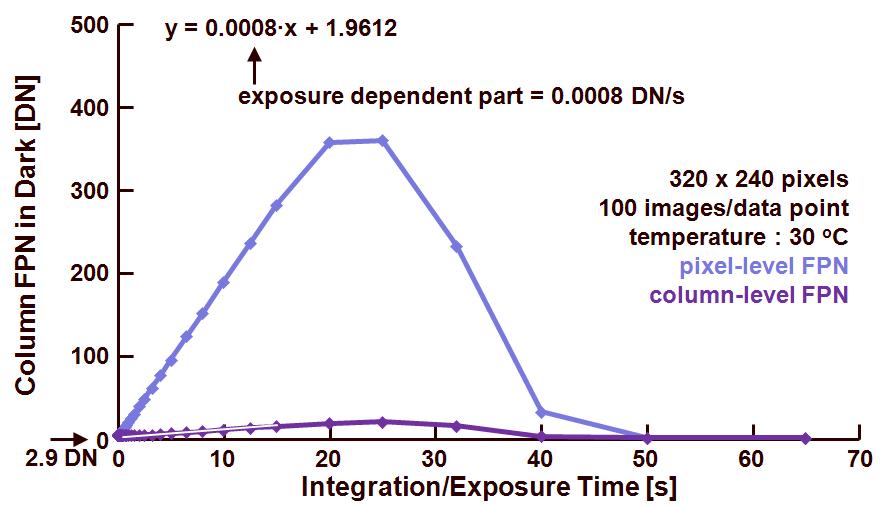
The result of this calculation is shown in figure 1, indicating the column FPN in dark as a function of exposure time.

next_blog_1

Figure 1 : fixed-pattern noise in dark as a function of the exposure time.

There are two curves shown :

       the first represents the pixel-level FPN, already discussed previously,

       the second one is showing the column FPN in dark, which is remarkably lower than the pixel FPN.  The following data can be obtained from the curve : 2.9 DN is the FPN at 0 s exposure time, and the time depending part of the column FPN equals to 0.0008 DN/s.  At 25 % of saturation level or an exposure time of 8s, the column FPN is equal to 7.8 DN rms.  Taking into account the absolute values mentioned earlier, the column FPN can be calculated to be equal to 0.95 % at 25 % of saturation.

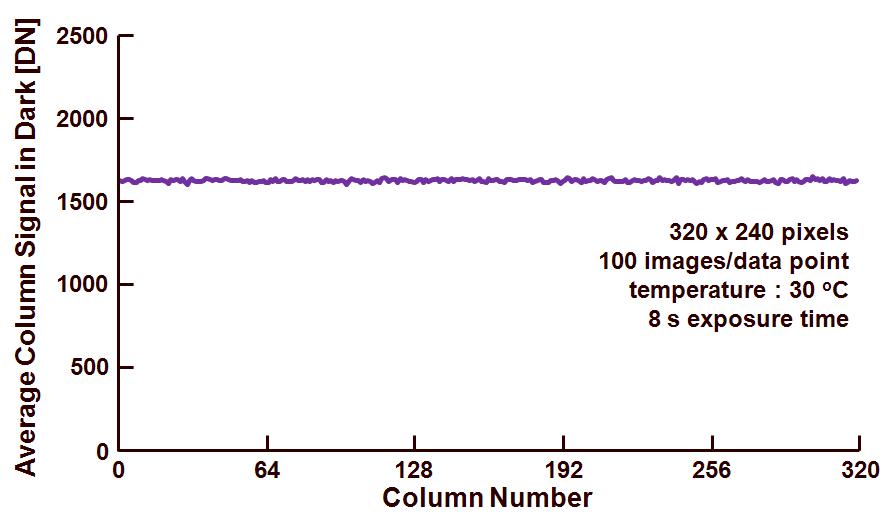
The ratio between the DSNU on pixel level and the column FPN is equal to : 0.0188/0.0008 = 23.5, whereas the theoretical value would predict : (number of lines)0.5 = 15.5.  To find out where this discrepancy is coming from, the uniformity of the average column value of every column is checked at a particular exposure time (8 s).  The result is shown in Figure 2.

111011_blog_2

 Figure 2 : average column signal in dark at 8 s exposure time.

As can be learned from the data in Figure 2, the average column value is very constant (also expressed by the low column FPN rms value), and it is not expected that something is wrong with the calculation of the column FPN in dark.

 “There is a warning sign on the road ahead” : actually there is even more than one warning sign on the road ahead, but they are already listed in the previous blog.

Albert, 11-10-2011.

Herman PEEK : 50 years in silicon/CCD technology

September 30th, 2011

This week it is exactly 50 years ago that Mr. Herman Peek started working at Philips Research in silicon technology.  By it self nothing special of course, but keeping in mind that he still is active in silicon technology it is a more than remarkable achievement !  I had the luck of working with him from 1983 (when I joined Philips) till 2007 (when I left DALSA).  I do not recall all the history, but in 1983 Herman was already working on CCD technology when I met him for the first time.  He developed the semiconductor technology that was and still is applied to fabricate these great imaging devices.  Based on his ideas, Philips’ CCD reached world records in dark current as well as in area size.  Together with Herman (and many others) we developed the first full resolution HDTV sensors for broadcast use in the late ’80s and early ’90s.  The fundaments developed at that time can still be found in the today’s devices : stitching, tungsten strapping, low-noise output stage and dynamic pixel management.  After Herman reached the age of going after a pension, he stayed part-time on board as a consultant in CCD technology and he still is working part-time for Teledyne-DALSA (after the Philips’group was acquired by DALSA).  With this short message I would like to send my CONGRATULATIONS to Herman and would like to thank him for his great contributions to the CCD technology.  As Eric Fossum already stated during the last IISW, it is on the shoulders of these giants that we are standing.  Wish Herman a lot of pleasure in the years to come !

Albert, 30 September 2011.

How to measure the Fixed-Pattern Noise in Dark or DSNU (1)

September 22nd, 2011

As a logical next step in the “How to Measure” discussion is to look after the non-uniformities in dark or Dark-Signal Non Uniformity (DSNU).  These are the variations of the dark signal from pixel to pixel.  It should be noted that the dark-signal itself can be composed out of :

       a thermal component, which will depend on the temperature and on the exposure time.  The thermal component will be present on pixel level,

       an electrical component, which is independent on the exposure time and almost independent on the temperatue.  This electrical component is due to threshold variations, gain variations and other imperfections in the electronic circuits.  It can be present on pixel, column and row level.

Just like in the case of the average dark signal, the non-uniformities are calculated (!) based on several images taken in dark conditions.  To limit the influence of any thermal noise component, several images need to be taken, preferably at various exposure or integration times.  Basically, the same data or images as used in the case of measuring the average dark signal can be reused.  So after averaging all images taken at a particular exposure time to reduce the thermal noise, calculations can take place on the averaged resulting image.

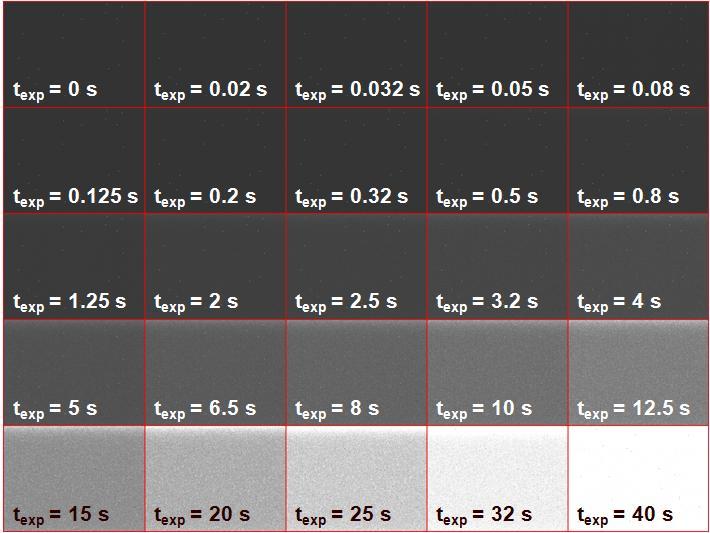
These averaged images are shown in Figure 1 : for 25 different exposure times, the result is visualized in the mosaic image.  Corresponding exposure times are indicated.

 110910_blog_12

Figure 1 : dark images as a function of the exposure time, taken at 30 deg.C.

As can be seen from Figure 1, the sensor saturates at longer exposure times.  This is due to the limitation of the ADC in combination with the gain setting of the camera.  These effects will be explained and measured later in another blog.   

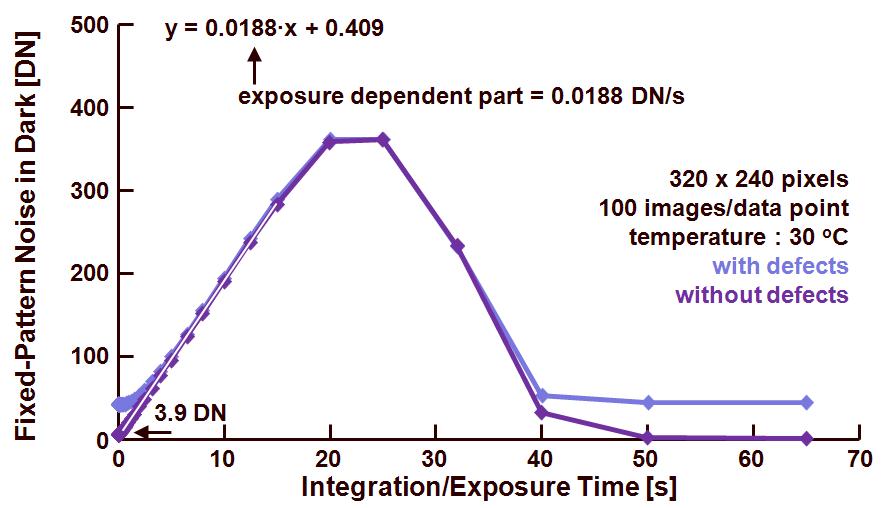
A first way of measuring/calculating the DSNU is to check its behavior as a function of exposure time.  These result of this is shown in figure 2.

110910_blog_22

Figure 2 : fixed-pattern noise in dark as a function of the exposure time and at 30 deg.C.

[!!!! there is a typo on the figure !!! the exposure dependent part = 0.0188 DN/ms !!!]

There are two curves shown :

       the first one contains all data delivered by the sensor, including the defects (black and white defects).  The latter ones hamper a linear behavior in the beginning of the curve.  And they do not allow the FPN to go to zero for high exposure times

       the second one is based on the same data after the correction of dead pixels.  This time the curve shows a better linearity as well as a fixed-pattern noise equal to zero for the highest exposure times.  Notice that in the latter case the output signal of the sensor is saturated by the ADC, and no FPN can be detected.

The FPN for zero exposure time, or the exposure time independent part of the FPN is found to be equal to 3.9 DN.  From the regression line calculated by means of the curve without defects, the time depending part of the FPN, being the dark current FPN, and equal to 0.019 DN/ms.

How to express the FPN of a sensor or a camera ?  As could be learned, part of the FPN is depending on the exposure time (and temperature), another part is not.  This makes the expression of the dark signal non-uniformity or DSNU not always uniform.  For example in the case illustrated, and specified at an average signal level of 25 % of saturation and an exposure time of 8 s, the DSNU can be expressed as :

       Maximum value of dark signal = 2905 DN and minimum value of the dark signal = 1373 DN.

       Peak-to-peak value of 1532 DN.

       Root mean square (rms) value equal to 150.5 DN.

Without knowing the average value of the dark signal, all these numbers are meaningless.  Because it is impossible to judge whether these values represent a large DSNU or not.  For that reason, taking the average dark signal of 1637 DN into account, the DSNU can also be expressed as 57.0 % of the average signal at 25 % of saturation.  This gives a much better judgement of the DSNU.

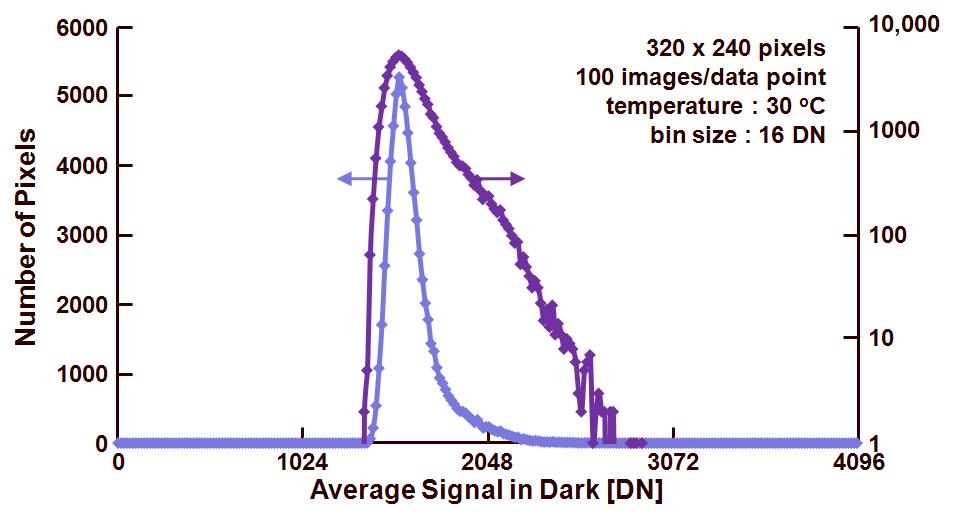
Notice that all these numbers represent the DSNU, but intrinsically they do not tell anything about the distribution of the dark fixed-pattern noise.  The right answer to this issue is to show the histogram of the dark signal.  Only in this way one can get a good idea about the randomness of the FPN in dark.  This is illustrated in Figure 3.

110910_blog_3

Figure 3 : histogram of the average signal in dark, taken at 30 deg.C.

The same data is shown in the two curves, but one on a linear vertical axis, the other one on a logarithmic vertical axis.  Notice that only in the latter case the outliers can be seen in the tail of the distribution !  Although not that many pixels have an outlier, they do show up immediately once the device is put into dark and they heavily contribute to the visual image quality.  So a logarithmic scale on the vertical axis should be the preferred way of dealing with histograms of average dark sensor signals.

 “There is a warning sign on the road ahead” :

       It is clear that the dark signal non-uniformities are depending on the exposure time, so accurately measuring or defining this parameter is very important,

       The average dark signal as well as the non-uniformities are exponentially depending on the temperature.  As a consequence, the temperature of the device under test needs to be stabilized with an accuracy of 1 deg.C, a change of 1 deg.C in device temperature can result in 10 % deviation of the dark signal.  Notice that the device temperature is not necessarily also room temperature or vice versa !  If the outcome of the average dark signal measurement is used for calibration purposes, the exact knowledge of the device temperature becomes of crucial importance,

       At this moment in the discussion, there is not yet any interest in the temporal noise behavior of the sensor or camera.  To limit the influence of the temporal noise on the measurements it is recommended to take many images in dark and averaged them on pixel level.  In this way the temporal noise will be averaged out,

       Fixed pattern noise can have several origins, it can come from the pixel, the row, the column, shading effects and saturation non-uniformities.  The split of the overall FPN into these various components will be discussed next time.

Albert, 19-09-2011.

Short feedback about SIVS : Swiss Image and Vision Sensors, September 8th, 2011.

September 9th, 2011


As far as I know, for the first time an image sensor workshop was organized by and at the ETH, Zurich in Switzerland.  Tobi Delbruck, opened the workshop by indicating that one of the workshop goals was to give an overview of the state-of-the-art of image sensors in Switzerland.  At the end of the workshop the conclusion could be that Tobi succeeded in reaching his target.  Not that much new items or technologies were disclosed, but several good speakers reviewed their technology and/or their products.

The session before lunch could be headed as : “What can/did we learn from the human retina ?”.  The first speaker taught us how to reverse engineer the human retina to get a better understanding about its functionality.  Next a couple of talks illustrated what already is implemented in silicon based on the working principle of the human retina.  Quite interesting to see how the human visual system is capable of transmitting and processing only useful information.  Or the human visual system only becomes active if there is really some new information observed.  In contradiction to that, the classical image sensors generate and deliver an incredible amount of redundant data and information.  The classical silicon image sensors are absolutely not efficient in the generation and transmission of data.  So here we still can learn a lot from mother nature.

An interesting lesson that could be learned after the morning session : even the most fanatic and academic researchers were complaining about the lack of marketing efforts to get their ideas, technologies, devices to the market.

The session after lunch and before the afternoon coffee break could be seen as a CSEM session.  Four different speakers (still with or no longer with CSEM or even still with but will shortly leave CSEM) highlighted particular aspects of the CSEM’s projects.  Nice talks, but most of them were already delivered at other conferences.  So basically not that much new information was presented, at least not for the people in the audience that regularly attend imaging conferences and workshops.

The last session of the SIVS workshop was devoted to speakers that talked about products that came recently on the market.  Some of the talks were illustrated by means of live demos.  And that always works : “Seeing is Believing”.  The workshop concluded with a short forum, a poster/demo session and a drink.

Conclusion : good overview of the imaging state-of-the-art in Switzerland, no groundbreaking technologies or ideas were disclosed, good atmosphere !  Thanks to Tobi and Shih-Chii for the organization.


Albert, 09-09-2011

New book on the market : “Single-Photon Imaging”

September 5th, 2011


I am very happy and pleased to announce the publication of a brand new book, entitled “Single-Photon Imaging”.  The book is published by Springer (ISBN 978-3-642-18442-0), and it is edited by my great friend Peter Seitz (CSEM and professor at the University of Neuchatel, both Switzerland) and myself.  I am not ashamed to tell that most of the work is done by Peter.  Without his drive and motivation it would have taken much longer to get the book ready.  It was really great working with Peter on this project.  The way of working with him reminds me about a Swiss watch : always on time.  Thanks Peter !

Also a big “Thank You” goes to the authors who wrote all the material.  I do realize that all of us are very busy and that writing a book chapter takes up a lot of time.  It should not be a big surprise that most of the authors put a lot of their private time in the writing of the material and this is highly appreciated.

Last but not least it is a pleasure to express my acknowledgement to all the people who are willing to buy and to read the book.  I do hope you will enjoy it !

For those interested, you can find more information about the book here.

Albert, 04-09-2011.

How to measure the average dark signal ?

August 25th, 2011


The very first item that will be discussed in the new serie of blogs “How To Measure … ?” will be the average dark signal. 

Actually, what is the dark average dark signal of a sensor or a camera ?  By definition it is the output of the image sensor or the camera when the system is put in dark.  This seems to be very straight forward, but a dark signal measurement needs to be done in fully dark conditions !  Just capping the lens of a camera to shield the sensor from incoming light is not enough.  Still light can come from the sides or even from the back to the sensor.  For that reason the camera needs to be 100 % shielded from “surrounding” light as well.  In addition to a capped lens, the measurement room can be made dark and/or the sensor can be covered with a black, non-transparent cloth. 

On the other hand, the average dark signal delivered by a sensor or a camera will be composed out of several components :

       A fixed DC offset, very often introduced by the analog circuitry on pixel-, on column- and on chip-level, or by an extra black level offset,

       A thermal component, also known as the dark current or leakage current.  This part is not just (exponentially) depending on the temperature but has a linear dependency on the exposure or integration time as well (at least if saturation of the sensor is not reached).

The simplest way to separate the DC offset from the thermal component is to perform measurements at several exposure or integration times.   These measurements can be done by means of :

       A good old oscilloscope : in this way one can measure the average output voltage of a sensor or camera,

       The measurement of the reset-drain current.  This technique is only applicable if the drain(s) of the reset transistor(s) is/are available through a separate connection.  This is the case for CCD imagers, this is not the case for CMOS imagers.  So CCDs do offer a very easy way of measuring the average output signal, just by measuring the average reset drain current.  The relation between the measured reset drain current IRD and the average number of electrons in one pixel Npix is given by :

 Npix = IRD/(q .Nfr .NH .NV)

            with :

§  Npix : average number of electrons per pixel,

§  IRD : reset-drain current in [A],

§  q : charge of 1 electron [= 1.6?10-19 C],

§  Nfr : number of frames/s,

§  NH : total number of pixels in horizontal direction (including black reference pixels),

§  NV : total number of pixels in vertical direction (including black reference pixels).

       Grabbing images in dark by means of a frame-grabber and a computer.  Once the data of the dark images is present in the computer, calculation of the average dark signal becomes very simple.

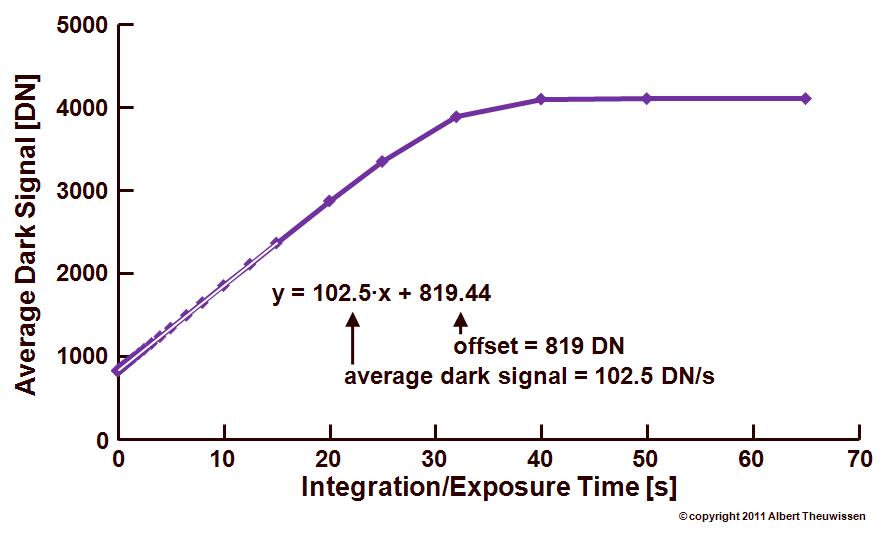
Figure 1 shows the outcome of an average dark signal measurement : at various exposure times and at 30 oC, multiple images are being grabbed, e.g. 25.  At each exposure time all these images were averaged (to reduce thermal noise) and the averaged image is again averaged over all its pixels (to reduce fixed-pattern noise).  In this measurement a sensor with 320 x 240 pixels is evaluated.  So every dot in Figure 1 is the result of 320 x 240 x 25 = 1,920,000 pixels.
110825_blog_1

 Figure 1 : average dark signal as a function of the exposure time, measured at 30 oC.

From the regression line for the linear part of the curve in Figure 1, the following numbers can be deduced :

       Offset, independent of the exposure time, being equal to 819 DN,

       Time depending part of the output signal, being the dark current, and equal to 102.5 DN/s.

How to express the average dark current of a sensor or camera ?  As could be learned, this is only the exposure time depending part of the dark signal and it is a kind of leakage current, and for that reason the preferred way is to express it as :

       a current for the whole sensor,

       a current density per cm2, or per pixel (in that case numbers can be very small !),

       number of electrons per pixel and per second.

Other ways of expressing the dark current are :

       digital numbers (DN) per pixel and per second,

       voltage per pixel and per second.

In the latter two cases, the numbers indicated do include also the conversion gain of the sensor.  Interpretation of the results is then becoming tricky !  On the other hand, if the results need to be expressed as a current, the conversion gain needs to be known.  (Regular readers of this blog should know in the mean time how to extract the conversion gain, it will be repeated at a later stage of this blog.  But at this point in the evaluation of the sensor the conversion gain is not yet kwown, which does not allow to express the dark signal as a current.)

“There is a warning sign on the road ahead” :

       It is clear that the average dark signal is depending on the exposure time, so accurately measuring or defining this parameter is very important,

       The average dark signal is exponentially depending on the temperature.  As a consequence, the temperature of the device under test needs to be stabilized with an accuracy of 1OC, a change of 1OC in device temperature can result in 10 % deviation of the dark signal.  Notice that the device temperature is not necessarily also room temperature or vice versa !  If the outcome of the average dark signal measurement is used for calibration purposes, the exact knowledge of the device temperature becomes of crucial importance,

       At this moment in the discussion, there is not yet any interest in the temporal noise behaviour of the sensor or camera.  To limit the influence of the temporal noise on the measurements it is recommended to take many images in dark and averaged them on pixel level.  In this way the temporal noise will be averaged out,

       The dark signal will change from pixel to pixel (see one of the next blogs) and can also be influenced by a shading component (slowly varying from one side of the sensor to the other side of the sensor).  Non-uniformities and shading are both included in the average output of the sensor on dark.  Or, the average dark signal does not tell anything about the uniformity of it !

       How is the output data of a camera presented to the user : with or without dark level or black compensation ?  In the case the data is available without dark level compensation (also called “absolute dark reference” or “absolute black”), the measurement and calculation of the dark signal is very straight forward and can be done as shown above.  In the case the data is available with dark level compensation (also called “relative dark reference” or “relative black”), the measurement of the average dark signal is becoming a bit more tricky.  In the latter situation, a characterization through noise measurements can be done.  Noise measurements will follow later in another blog.  In this blog only data with an absolute dark reference was discussed.

Albert, 25-08-2011.
 

Long time no see ….

August 9th, 2011


It has been a couple of weeks since my last post on the blog.  I was a bit too busy and the combination with holidays slowed down the writing process.  But now that the holidays have passed, I will try to make some time to start blogging again.  After the almost endless series on the Photon Transfer Curve, it is time to start with soemthing new.  The main topic of the new blogs will be HOW TO MEASURE … ? and you can replace the dots by any characteristic of the image sensor.  Parameters of interest that will be discussed are going to be the dark current, dark non-uniformities, dark shading, etc, etc.  This list is going to be also very long.  The discussion of the measurements will be supported with data coming from artificial as well as from real images.   Hopefully you as well as myself will learn from it.  After all, that is the motivation to do this : sharing knowledge and improving our understanding of the imagers.

The first blog of this series that you can expect will be on the measurement of the average dark current will be discussed.  It looks very straight forward, but there there a couple of interesting pitfalls.  I am looking forward to it !!!

Albert, 08-08-2011.