In this relatively short blog, the linearity of the individual pixels will be checked. Up to now, in the previous blogs, a window of 50 x 50 pixels was taken into account to evaluate the “average” non-linearity of these 2500 pixels. Because the data of all individual pixels is available as well, it can be a helpful exercise to check the non-linearity of each individual pixel.
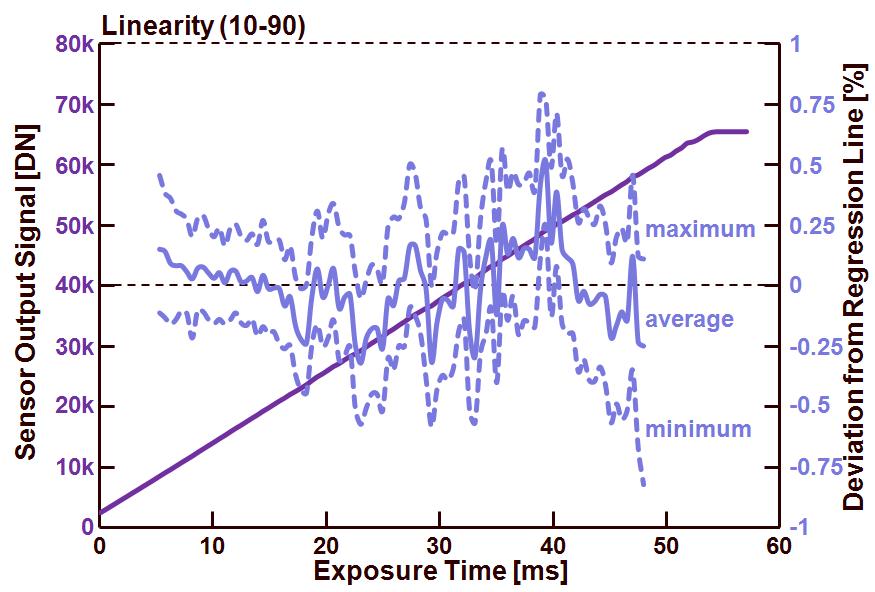
The results shown in this discussion refer to the measurements done with a camera gain=1, linearity check between 10% and 90 % of saturation, and with exposure times used up to 60 ms to saturate the sensor (see also previous blogs).
Figure 1 shows the average integral non-linearity (INL) for all the 2500 pixels, as well as the maximum value and the minimum value of the INL that can be found with one of the 2500 pixels (maximum and minimum value do not have to come from the same pixel !).
Figure 1 : Camera output (left axis) and INL (right axis) for an sensor output range between 10 % and 90 % of saturation and a sensor/camera gain setting equal to 1.
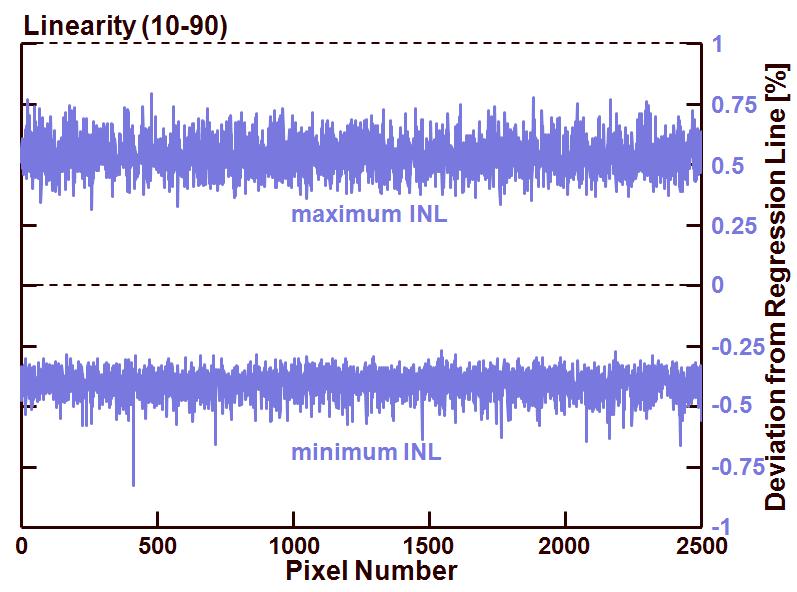
As can be seen from the figure, all the worse case INL values of these 2500 pixels nicely follow the trend of the average value. Another analysis that leads to the same conclusion can be found in figure 2. Here the maximum and the minimum deviation of each pixel is shown.
Figure 2 : Maximum and minimum INL value of the 2500 different pixels.
Conclusion : All pixels within the region of interest behave more or less the same as far as INL is concerned. So it is safe to evaluate the INL by means of the average behaviour of the 2500 pixels belonging to the ROI of interest.
Next time the non-linearity of small signals (between 0 % and 10 % of saturation and between 90 % and 100 % of saturation) will be checked.
Albert, 17-05-2013.

