Following-up on the previous blog with the definitions of non-linearity, this time the first results will be shown and discussed, focusing on the integral non-linearity or INL of the solid-state camera.
To perform the measurements, the amount of light coming to the sensor is changed by varying the exposure time under constant light conditions (green LEDs). The amount of light that is coming to the sensor is not measured. All evaluations are done with a camera without lens, and with a window containing 50 x 50 pixels. Unless otherwise indicated, all results refer to the average value of these 2500 pixels.
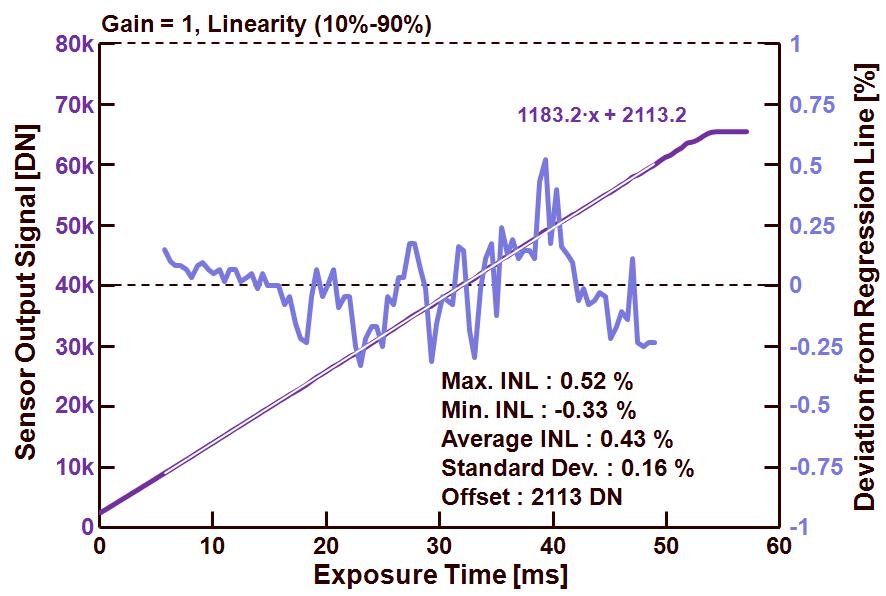
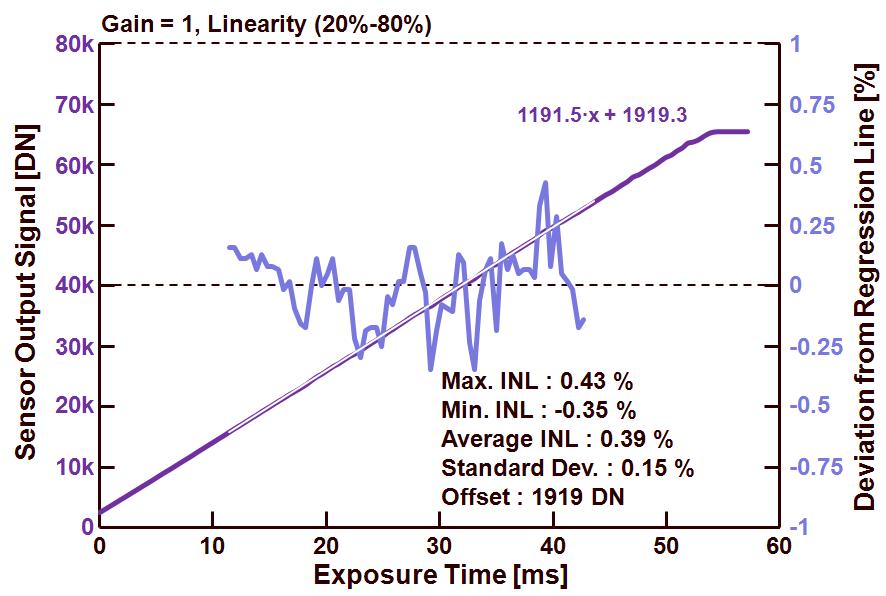
In Figures 1-4, the measurements and calculations are shown which are obtained when the gain of the camera was set to 1. The difference between the various figures is the sensor output range over which the INL is calculated : Figure 1 from 1 % to 99 % of saturation, Figure 2 from 5 % to 95 % of saturation, Figure 3 from 10 % to 90 % of saturation and Figure 4 from 20 % to 80 % of saturation. All data about the INL are included in the figures.
Figure 1 : Camera output and INL for an output range between 1 % and 99 % of saturation.
Figure 2 : Camera output and INL for an output range between 5 % and 95 % of saturation.
Figure 3 : Camera output and INL for an output range between 10 % and 90 % of saturation.
Figure 4 : Camera output and INL for an output range between 20 % and 80 % of saturation.
Some remarks :
– All output signals in all figures have a fairly abrupt transition from their linear behaviour towards saturation. This is due to the fact that the ADC is defining the maximum output signal and not the pixel or the source-follower,
– The output data of the camera is formatted into 16bits TIFF, the sensor has an ADC with 10 bits, and to convert the 10 bits into 16 bits, simply 6 bits are being added to every pixel output,
– Max. INL indicates the maximum positive deviation of the camera output compared to the regression line drawn through the measurement points, Max. INL is expressed in % of the saturation level (= 216 – offset),
– Min. INL indicates the maximum negative deviation of the camera output compared to the regression line drawn through the measurement points, Min. INL expressed in % of the saturation level (=216 – offset),
– Average INL is the mean of the absolute value of the two foregoing parameters, Average INL is expressed in % of the saturation level (=216 – offset),
– Standard Dev. is the standard deviation of all INL data points, Standard Dev. is expressed in % of the saturation level (=216 – offset),
– Offset : refers to the offset of the camera output, found by extrapolating the regression line to an exposure time equal to zero seconds,
– All parameters expressed as a percentage of the saturation level, can also be expressed in LSB, in that case 1 LSB of the sensor corresponds to about 0.1 %.
What can be learned from the four figures is the fact that all INL parameters are becoming better (= smaller) if the output range over which the INL is calculated, is becoming shorter or more limited. This is not surprising because very often, the largest non-linearities of a sensor can be found in the lower range of its output and the higher range of its output. This observation could give rise to the idea to limit the output range even further to calculation the INL … So it should be clear that together with the INL specification, it is necessary to mention over which output range of the sensor/camera the INL is specified.
What’s up next time ? INL in combination with gain setting of the camera.
Albert, 09-04-2013.


