It is again time to switch on the light and to measure the temporal noise of a sensor with light input. Actually, do not expect that much new information with this measurement as far as noise is concerned. Once there is light shining on the sensor and once the sensor is delivering enough signal, the photon shot noise will be the largest noise component and the measurement results will be dominated by this photon shot noise . And it is known that the photon shot noise (expressed in electrons) has a square-root relation with the amount of electrons generated in the pixels. There is no real need to proof the Poisson statistics again, others have done this already millions of time.
When measuring the temporal noise, it must be admitted that most interesting information is already found in the sessions without light input and with an exposure time equal to 0 s. Nevertheless, to complete the story about temporal noise measurements, also the evaluation of temporal noise with light will be discussed in this blog.
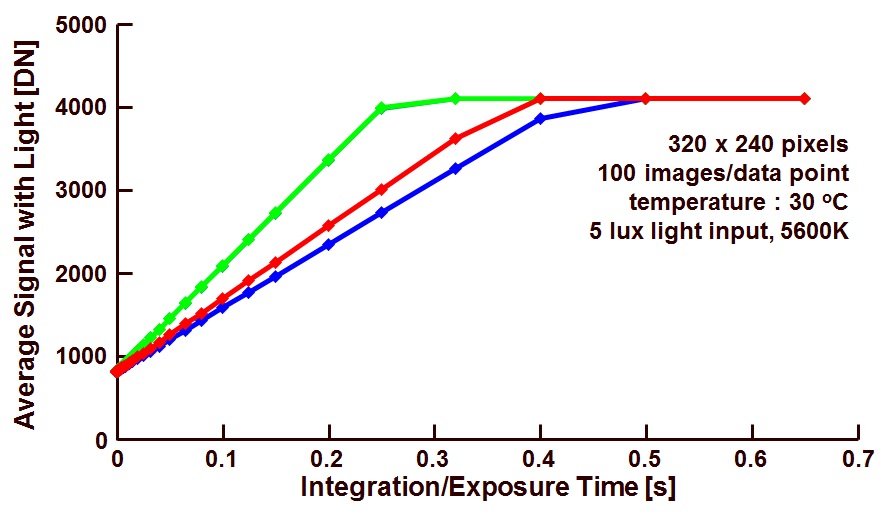
Figure 1 repeats the average output signal of the sensor, with light input, as a function of the exposure time. This information is already shown in an earlier blog.

Figure 1. Average output signal, with light input, as a function of the exposure time.
As can be expected, the various colours in Figure 1 represent the four colour channels of the device (red, green in red line, green in blue line and blue). The following remarks can be made :
– Offset at 0 s exposure time, being equal for all colour channels, being 820 DN,
– Saturation level being equal for all colour channels, the saturation levels are equal to 4095 DN. So the saturation level of the signals is determined by the maximum level of the ADC (being 212 -1 DN = 4095 DN). With the correction of the offset, the sensor delivers maximum 3275 DN,
– Sensitivity of the blue channel is lowest, next is red, and the most sensitive channels are the two green ones. This observation is the case for the light input parameters indicated, 5600K colour temperature, and 5 lux on the sensor.
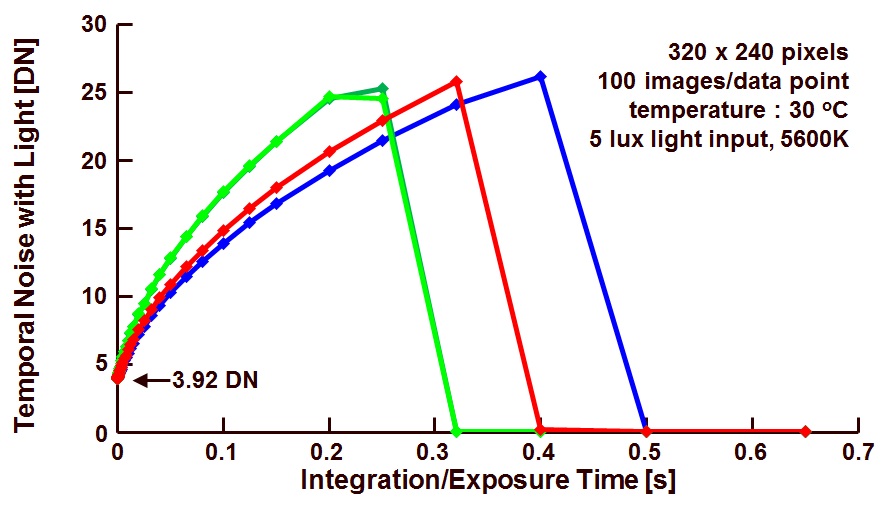
Figure 2 illustrates the measured temporal noise under the same light and sensor conditions as the one used in Figure 1.

Figure 2. Temporal noise of the sensor with light input, as a function of the exposure time.
Also from this graph a few interesting remarks can be made :
– For an exposure time 0 s, the minimum noise is equal to 3.92 DN. This is the noise floor of the sensor in dark at 0 s exposure time,
– For increasing exposure times, the noise increases as well, but in a non-linear way. This is due to the fact that for larger exposure times, the noise is dominated by the photon shot noise, and the latter has a square-root relation with the average signal (in the charge domain),
– Because the sensitivity of the green channels is the largest of all, and the sensitivity of the blue channel is the lowest, the same is true for the noise levels at a particular exposure time,
– As soon as the signals saturate, the temporal noise is quickly dropping to a very low level. This is due to the fact that the ADC is saturating and fixing the output value of the signal to 4095 DN and any further noise content in the analog signal does not show up in the digital representation of the output signal.
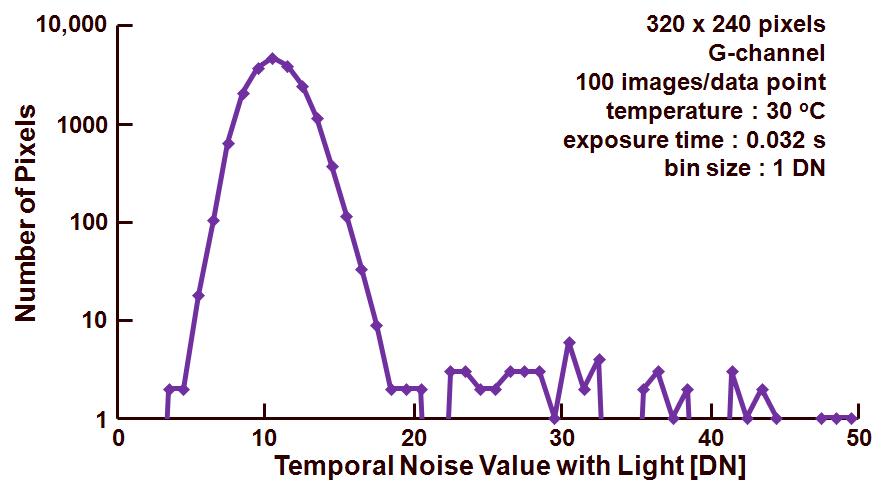
Figure 3 shows the temporal noise histogram, obtained at an exposure time of 0.032 s, at which the green channels reach 25 % of saturation.

Figure 3. Noise histogram for the sensor with light, only one of the green channels is shown.
At the left side in Figure 3, the Poission distribution of the photon shot noise can be recognized. The tail at the right side in the histogram is representing the pixels of which the temporal noise is dominated by 1/f and RTS noise.
Albert, 13-07-2012.