In the previous “How to measure” blog the basic measurement and calculation of the PRNU or Photo-Response Non-Uniformity was discussed. Although the mentioned numbers were not that high, it is always wise to check where the PRNU is coming from. A possible source of non-uniformity with light is shading : a low-frequency component that changes the response of the pixels (e.g. from top to bottom, from left to right, from the middle towards the corners of the sensor). Even if the shading component is small, it can result in (minor) changes in spectral response across the sensor. These type of errors can have a severe effect on colour shading in a colour sensor and can make colour reconstruction pretty complicated. So it absolutely worthwhile to check out the shading under light conditions.
To evaluate the light shading, a similar method can be used as the one applied to evaluate the dark shading. Also the same images are used as before : multiple light images taken at room temperature and at different integration times. To quantify the light shading, the images taken at an exposure time of 80 ms are used : at 80 ms, the average signal is 25 % of the saturation level. Because light shading is the low frequency variation of the signal, the following procedure will be followed :
– all images captured at 80 ms integration time are averaged, in this way the temporal noise will be reduced,
– the averaged image will be forced through a low-pass filter with a 9×9 filter kernel. This operation will reduce the (high-frequency) FPN.
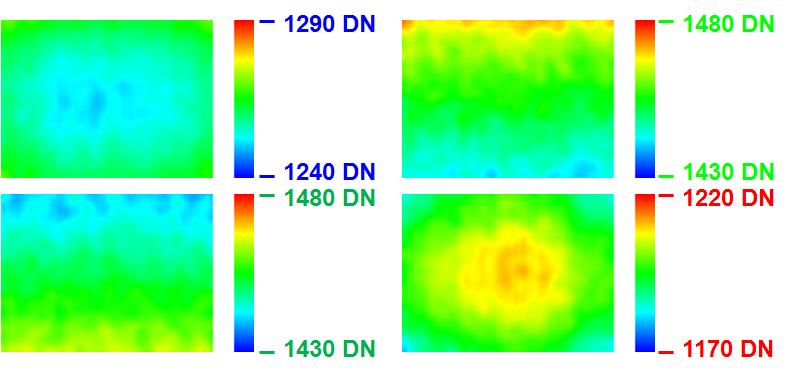
The result after averaging and filtering is shown in figure 1.

Figure 1 : low-frequency variation in light signal at 80 ms integration time.
Clearly visible in figure 1 is the non-uniformity of the light signal :
– top left is the shading of the blue pixel ; which looks circular symmetric, with its lowest signal value in the center of the sensor,
– top right is the shading of the green pixel in the blue line ; which looks to have an increasing signal towards the top of the sensor,
– bottom left is the shading of the green pixel in the red line ; which looks to have a decreasing signal towards the top of the sensor,
– bottom right is the shading of the red pixel ; which looks circular symmetric, with its highest signal value in the center of the sensor.
The shading illustrated in figure 1 can be expressed as :
– the peak to peak value, equal to 20 DN, 36 DN, 30 DN and 41 DN for the four different colour signals,
– maximum value, equal to 1270 DN, 1475 DN, 1467 DN, 1211 DN, and minimum value, equal to 1250 DN, 1439 DN, 1437 DN, 1180DN for the four different colour signals.
In principle these numbers are more or less meaningless without any further “reference”. The additional parameters needed are :
– evaluation temperature, being room temperature,
– integration time, being 80 ms,
– dark signal offset, being 819 DN,
– average signal with light without offset correction, being 1260 DN, 1457 DN, 1452 DN and 1195 DN for the four colour channels,
– average signal with light and with offset correction, being 441 DN, 638 DN, 633 DN and 376 DN.
Taking these numbers into account, the shading in the four colour is equal to 4.5 %, 5.6 %, 4.7 % and 10.9 % of the average sigal measured in each individual colour channel, and measured at 25 % of saturation. These numbers are not really that low, but take into account that not a standard deviation is mentioned, but a peak-to-peak value or a maximum deviation. Do you prefer to have lower numbers : simply reference the shading numbers to the saturation level and they will become about a factor of 4 lower. That is what is called “specmenship”.
Albert, 13-03-2012.