A few days ago I promised to write some material about how to measure temporal noise. Temporal noise measurements seem to be very difficult, but actually the reality is different. Based on the fact that temporal noise is simply the variation of a particular parameter in the time domain, multiple measurements of the same pixel in combination with some simple statistical calculations can do the job ! If one has the choice, the pixel that is going to be sampled is not illuminated, otherwise the photon shot noise will be measured (and there are plenty of people who did this already before !). Also the dark shot noise needs to be avoided, so preferably a pixel with 0 ms exposure time is analyzed. Besides the photon shot noise and the dark shot noise, other noise components present when measuring the temporal noise are :
– Johnson noise of all resistive components,
– 1/f noise of the MOS transistors (mainly the source-follower in CMOS pixels),
– kTC noise (if not cancelled by CDS),
– quantization noise of the ADC, and,
– any other noise contribution of extra electronics on-chip or off-chip.
Actually there are several ways to measure the temporal noise of an image sensor :
– After sampling a particular pixel multiple times (the more the better !) the rms value of all measurements is calculated. This will give the noise in mV, DN or maybe even in another measurable quantity,
– The usage of a spectrum analyzer, to evaluate the temporal noise as a function of the frequency. This type of measurement can help in localizing a particular noise source that is popping up at a specific frequency (e.g. power supply related noise),
– Once the fixed-pattern noise is known of an imager, grabbing a single image (containing temporal and fixed-pattern noise) and subtracting from it the FPN image can result in a temporal noise measurement as well,
– The photon transfer curve (with or without light as discussed in this blog).
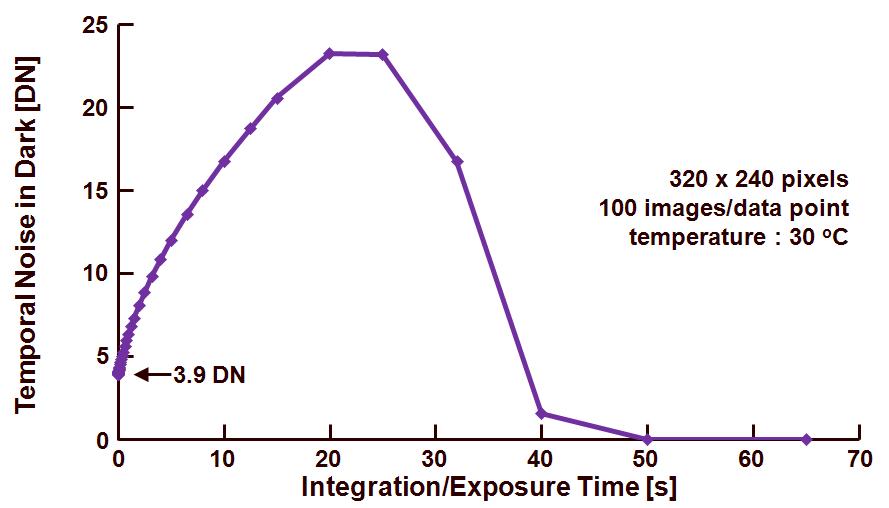
The data or images that are going to be used in the analysis of the temporal noise are the same ones as already used in the discussion of the fixed-pattern noise. The average dark signal as a function of the exposure or integration time is already shown in an earlier blog, here only the temporal noise in dark is shown in Figure 1. To calculate the temporal noise the following procedure is followed :
– Grabbing 100 images in dark at various exposure times, including an exposure time of 0 s,
– Based on the 100 images obtained at every exposure time, the noise on pixel level is calculated by calculating the rms value of the 100 values available for every pixel. In this way a noise value for every pixel is obtained,
– Finally the average value of all noise values (at every exposure time) is calculated and shown in Figure 1. So every single data point in the figure is the result of 320 x 240 x 100 = 7.7 M pixel values. (It is not an absolute must to include all pixels in the calculation of the temporal noise. To avoid some “edge effects” a smaller window or region-of-interest can be used for the noise calculations.)

Figure 1. Temporal noise, measured in dark, as a function of the exposure or integration time.
From left to right the following noise effects/components can be recognized :
– For an exposure time equal to 0 s, the temporal noise is equal to 3.9 DN. This is the absolute minimum value the noise can have, it is the contribution of all temporal noise sources excluding any photon shot noise (the measurement is done in dark anyhow), and excluding any dark-current related noise because of the chosen exposure time,
– Once the exposure time is larger than 0 s, the dark current shot noise is added, and the total noise increases. The increase is non-linear, because the dark shot noise has a square-root relation with the dark signal (this square-root relation is only valid in the charge domain !),
– The noise reaches a maximum (23.15 DN) at the moment that the dark-current generated signal + dark current shot noise is hitting the saturation ceiling of the pixel. At the onset of saturation, only a few pixels will saturate, but at a larger exposure time, more and more pixels will and ultimately the average noise level is going to decrease,
– Once all pixels are saturated, the temporal noise contribution of the pixel is becoming negligible.
But “There’s a warning sign on the road ahead” :
– All the images at a particular exposure time are represented in Figure 1 by means of a single number. This can be OK for a system that can be characterized by a global measurement (such as a CCD with a single output). But the CMOS pixels can have noise levels that differ from each other. Any variation from pixel to pixel cannot be detected from a single number. It should be mentioned that data sheets very often contain such a single number for the noise specification,
– Measuring noise and expressing it by means of a single number has the risk that it can be dominated by other noise sources, such as shading, fixed-pattern noise, defects,etc.
– No information is available on the type of noise,
– Dark current shot noise is strongly dependent on temperature, other noise sources change less with temperature. Thus noise characterization needs to be done on temperature-stabilized devices. Temperature variation should be less than 1 oC,
– Statistics on column noise and row noise can be of great importance to analyze the temporal noise of an imager. These topics will be subject of the next blog.
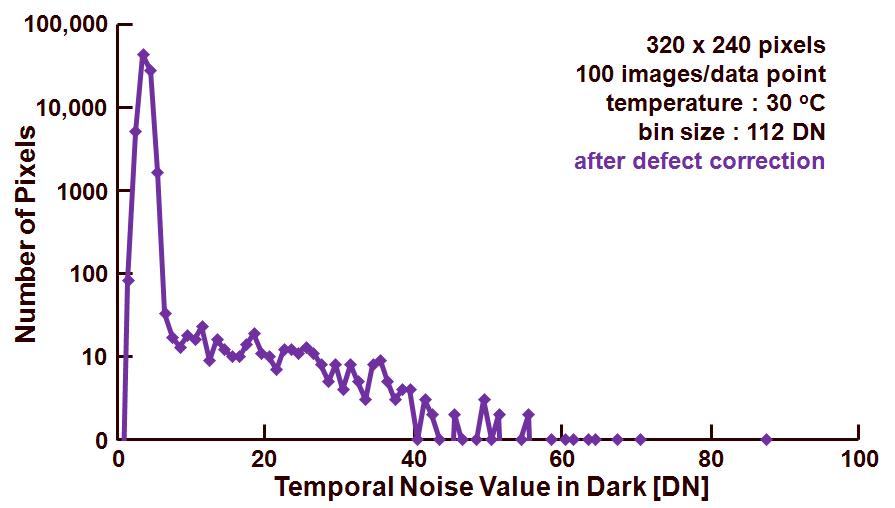
During the noise calculation, the data of the temporal noise of every single pixel is present. For that reason, it is quite simple to extract a histogram of the noise on pixel level. The result is shown in Figure 2.

Figure 2. Temporal noise (in dark) histogram of the pixel at 0 s exposure time.
To exclude any effect of the dark-current shot noise, the histogram is based on the data obtained at 0 s exposure time. As can be seen, the distribution has a fairly long tail. The latter is due to 1/f noise and RTS noise in the pixels. The main distribution, with a relative narrow and sharp needle is representing the pixels in which the dominant noise source is the Johnson noise.
Albert, 04-06-2012.