Last time the focus in the measurement discussion was on the amount of shading in the average signal under light conditions. This shading component will contribute to the PRNU, but to fully understand where the sensor’s PRNU is coming from, it might be wise to perform a first PRNU analysis with the shading component included, and a second one after the sensor’s signal is corrected for the shading. The difference between the two can give a clear insight in the effect of the shading on PRNU. This will be done in this blog.
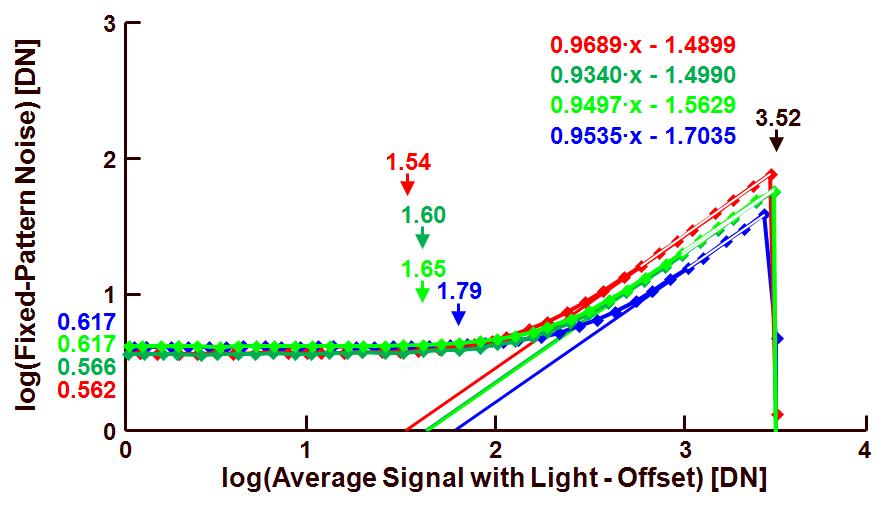
The PRNU data can be also obtained from a PTC-alike curve in which the FPN is plotted versus the average sensor’s signal (corrected for the offset). This is shown in Figure 1. Notice that the data on which this figure is based is obtained before any analysis and/or of the shading components.

Figure 1 : PTC-alike characterization of the fixed-pattern noise under light conditions, before shading correction.
From the data presented in Figure 1, the following results for the four colour channels (resp. blue, green in blue line, green in red line, red) can be extracted :
– PRNU for the various channels : 10-1.79 = 0.016 = 1.6 % for blue, 10-1.65 = 0.022 = 2.2 % for green in the blue line, 10-1.60 = 0.025 = 2.5 % for green in the red line, 10-1.54 = 0.029 = 2.9 % for red,
– FPN in dark for the various channels : 100.616 DN = 4.14 DN for blue, 100.617 DN = 4.14 DN for green in the blue line, 100.566 DN = 3.68 DN for green in the red line, 100.562 DN = 3.65 DN for red,
– Saturation level of 103.52 DN = 3311 DN.
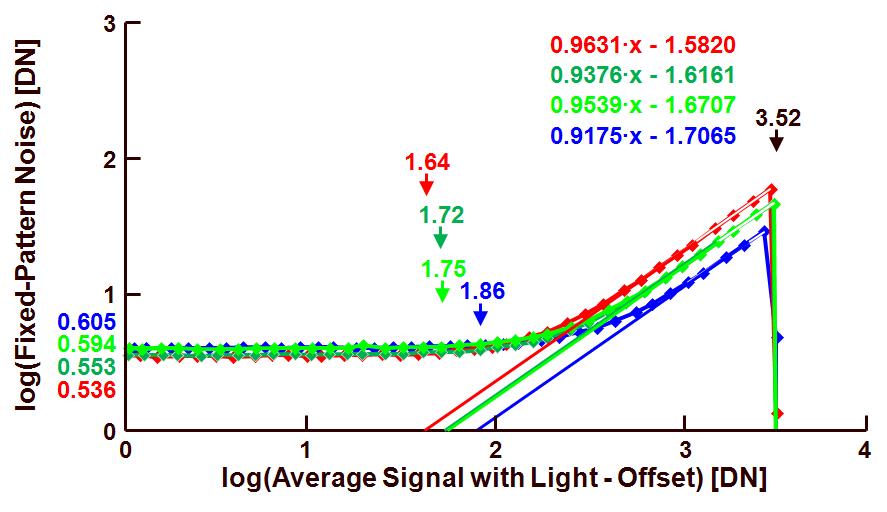
In a next step, the shading can be calculated (as explained in the previous blog) and the aforementioned data can be corrected for the shading. After correction, the data can be re-analyzed for its PRNU characteristics. The result is shown in Figure 2.

Figure 2 : PTC-alike characterization of the fixed-pattern noise under light conditions, after shading correction.
From the data presented in Figure 2, the following results for the four colour channels (resp. blue, green in blue line, green in red line, red) can be extracted :
– PRNU for the various channels : 10-1.86 = 0.014 = 1.4 % for blue, 10-1.75 = 0.018 = 1.8 % for green in the blue line, 10-1.72 = 0.019 = 1.9 % for green in the red line, 10-1.64 = 0.023 = 2.3 % for red,
– FPN in dark for the various channels : 100.605 DN = 4.03 DN for blue, 100.594 DN = 3.93 DN for green in the blue line, 100.553 DN = 3.57 DN for green in the red line, 100.536 DN = 3.44 DN for red,
– Saturation level of 103.52 DN = 3311 DN.
By comparing the data before and after shading correction is can be learned that correcting the shading is lowering the PRNU numbers (as could be expected). So one should be cautious with the interpretation of the PRNU numbers : do they include the shading, yes or no ? One may conclude, based on the numbers mentioned here before and after shading correction, that actually the shading does not have that much of an influence on the absolute PRNU numbers. But the opposite is true ! Even though the PRNU numbers do not reflect a large shading component, it might be present and can lead to unacceptable colour shifts in the images !
See you next time with FPN at saturation.
Albert, 05-04-2012.
Hi Albert,
Thanks for the useful post!
How come that shading correction leads to an improvement of the dark FPN too?
Andrea
Andrea, How did your correct the shading ? Did you take a dark reference frame ?
I guess you are talking about shading in dark ?
Albert.
Hi Albert
Why PRNU can be calculated as 10^-1.86 = 0.014 = 1.4 % for blue?
Hi, the curve at the right side of the figure (in blue) can be approached by y = 0.95x – 1.70. From this straight line, you can calculate the intersection with the horizontal axis (for y = 0), being -1.70/0.95 = -1.86. Because you are working on a log-scale, this means for a linear value 10^-1.86, being 0.014 or 1.4 %.
Hopefully this is clear now. Otherwise let me know.
Albert.
Hi Albert
Thanks, however as you say, y=0.95x-1.7. for the y=0, x will be 1.86.
I can understand that the intersection with horizontal axis will be 1.86.
But I can not understand why 10^-1.86 will be the PRNU.