Column FPN was the subject of the previous blog, so it will not be any surprise that this time the row FPN will be discussed. To calculate (!) the row FPN in dark, the same data or images as before are being used. The following procedure is followed :
– After removing/correcting the defect pixels, all images taken at a particular exposure time are averaged on pixel level, resulting in one (average) image per exposure time,
– Next, per row all pixels are being averaged, yielding an average value for every row (at every value of the exposure time),
– Once the row averages are available, the standard deviation on these average row values is calculated. In principle a single number will be found for all measurements done at every exposure time.
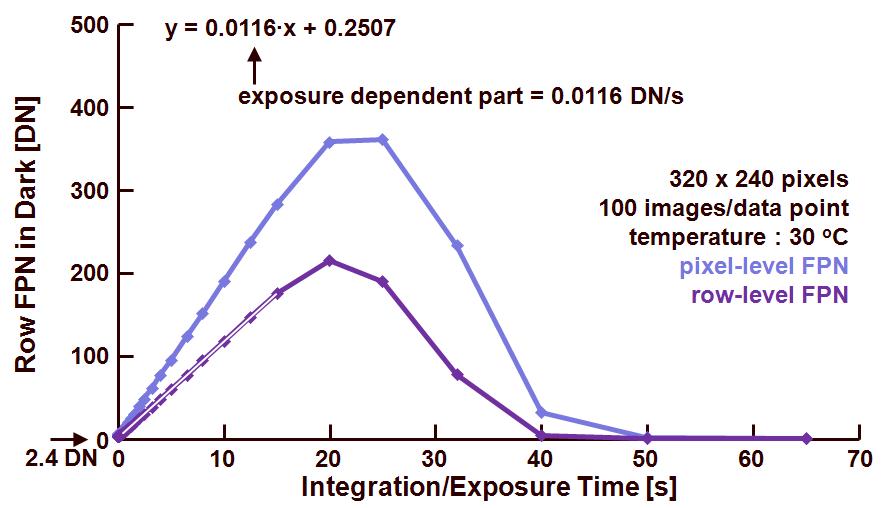
The result of this calculation is shown in figure 1, indicating the row FPN in dark as a function of exposure time.

Figure 1 : row fixed-pattern noise in dark as a function of the exposure time.
There are two curves shown :
– the first represents the pixel-level FPN, already discussed in a previous blog,
– the second one is showing the row FPN in dark, which is only a bit lower than the pixel FPN. The following data can be obtained from the curve : 2.4 DN is the row FPN at 0 s exposure time, and the time depending part of the row FPN equals to 0.0116 DN/s. At 25 % of saturation level or an exposure time of 8s, the row FPN is equal to 93 DN rms. Taking into account the absolute values mentioned earlier, the row FPN can be calculated to be equal to 5.7 % at 25 % of saturation.
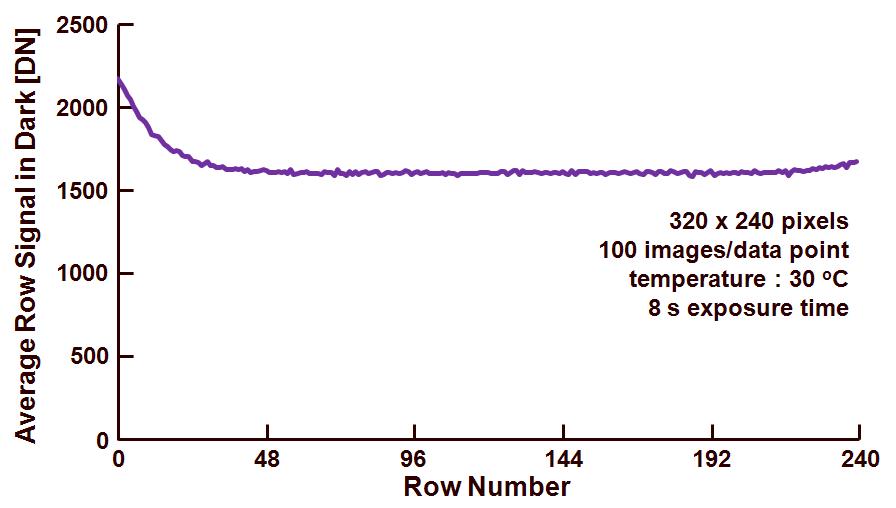
The ratio between the DSNU on pixel level and the row FPN is equal to : 0.0188/0.0116 = 1.6, whereas the theoretical value would predict : (number of columns)0.5 = 17.9. To find out where this large discrepancy (more than a factor of 10 !) is coming from, the uniformity of the average row value of every row is checked at a particular exposure time (8 s). The result is shown in Figure 2.

Figure 2 : average row signal in dark at 8 s exposure time.
As can be learned from the data in Figure 2, the average row value is absolutely not constant (also expressed by the high row FPN rms value). The figure clearly shows a large shading component in the average dark signal. This is the origin of the large row FPN and the fact that the ratio of pixel FPN over the row FPN does not follow the theoretical value.
Of course the large value for the row FPN is indicating a large non-uniformity of the average dark values on row level. But the origin of this non-uniformity does not necessarily need to be found in the row circuitry, the origin is coming from somewhere else. That will be the subject of next blog.
Albert, 01-11-2011.
Hello Albert
For the last effect I already use two names: “Hot Edge Effect” and “Smile effect”. Last one is for me the best one 🙂
Don’t forget that there is also row (column?) noise but not fixed.
Regards
Jacques
Thanks Jacques for the comments. Strange to learn that you call a negative effect a “Smile Effect”. We called it “Bathtub Effect”, but I have to admit, this neither that negative.
Temporal row and column noise will follow once the FPN discussion is finished. Regards, Albert.