In the previous blog we found that the pixel FPN in dark was equal to 18.4 % of the average signal at 25 % of saturation (corresponding to 8 s exposure time at 30 deg.C). These relative values can be translated in absolute values : rms value of DSNU is equal to 150.5 DN, while the average signal in dark is 1637 DN, the offset (in dark) being equal to 819 DN and saturation defined at 4095 DN. (In the previous blog the DSNU was not correctly calculated.) “Where is this DSNU coming from ?” is a more than valid question. In this blog we will analyze the column FPN.
To calculate (!) the column FPN in dark, the same data or images as before are being used. The following procedure is followed :
– After removing/correcting the defect pixels, all images taken at a particular exposure time are averaged on pixel level, resulting in one (average) image per exposure time,
– Next, per column all pixels are being averaged, yielding an average value for every column (at every value for the exposure time),
– Once the column averages are available, the standard deviation on the average column values is calculated. In principle a single number will be found for all measurements done at every exposure time.
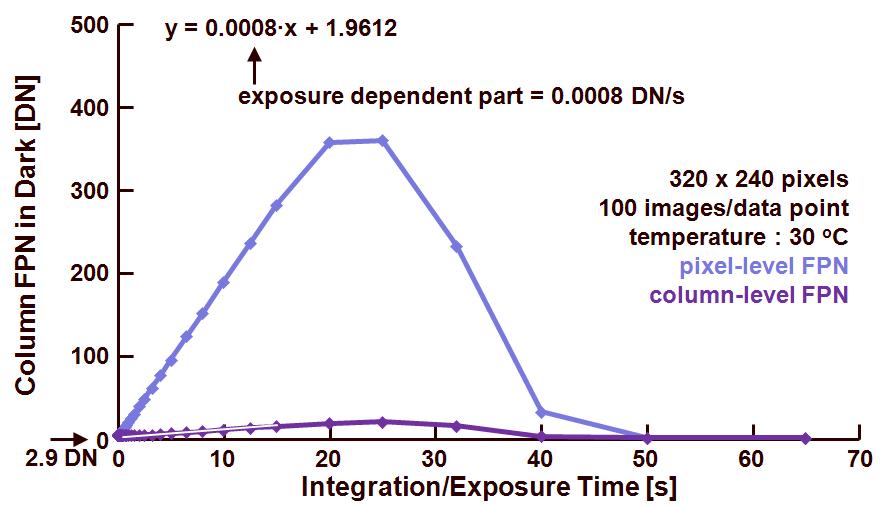
The result of this calculation is shown in figure 1, indicating the column FPN in dark as a function of exposure time.

Figure 1 : fixed-pattern noise in dark as a function of the exposure time.
There are two curves shown :
– the first represents the pixel-level FPN, already discussed previously,
– the second one is showing the column FPN in dark, which is remarkably lower than the pixel FPN. The following data can be obtained from the curve : 2.9 DN is the FPN at 0 s exposure time, and the time depending part of the column FPN equals to 0.0008 DN/s. At 25 % of saturation level or an exposure time of 8s, the column FPN is equal to 7.8 DN rms. Taking into account the absolute values mentioned earlier, the column FPN can be calculated to be equal to 0.95 % at 25 % of saturation.
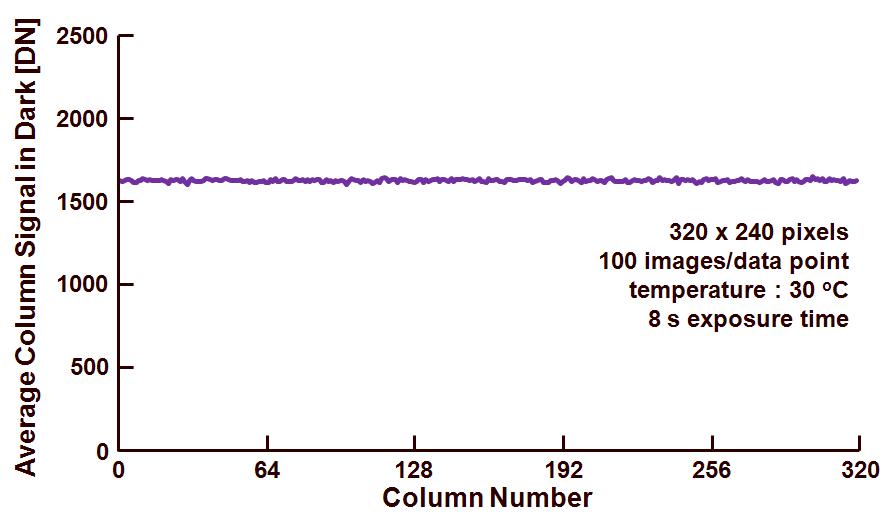
The ratio between the DSNU on pixel level and the column FPN is equal to : 0.0188/0.0008 = 23.5, whereas the theoretical value would predict : (number of lines)0.5 = 15.5. To find out where this discrepancy is coming from, the uniformity of the average column value of every column is checked at a particular exposure time (8 s). The result is shown in Figure 2.

Figure 2 : average column signal in dark at 8 s exposure time.
As can be learned from the data in Figure 2, the average column value is very constant (also expressed by the low column FPN rms value), and it is not expected that something is wrong with the calculation of the column FPN in dark.
“There is a warning sign on the road ahead” : actually there is even more than one warning sign on the road ahead, but they are already listed in the previous blog.
Albert, 11-10-2011.
Hi Albert,
How do you interpret this regression line: y=0.0008x+1.9612. At 20 sec, y=20*0.0008 + 1.96 = 1.976, whereas the curve shows a value of ~ 360. What am I missing here?
Thanks
Dear Satyah, please be careful, the regression line holds for the column FPN, and the curve you are referring to is the pixel FPN. Column FPN is much lower than the pixel FPN. So I think my calculations are correct, but you do have to apply the formulas to the right curve (the lower one, the column FPN).