As a logical next step in the “How to Measure” discussion is to look after the non-uniformities in dark or Dark-Signal Non Uniformity (DSNU). These are the variations of the dark signal from pixel to pixel. It should be noted that the dark-signal itself can be composed out of :
– a thermal component, which will depend on the temperature and on the exposure time. The thermal component will be present on pixel level,
– an electrical component, which is independent on the exposure time and almost independent on the temperatue. This electrical component is due to threshold variations, gain variations and other imperfections in the electronic circuits. It can be present on pixel, column and row level.
Just like in the case of the average dark signal, the non-uniformities are calculated (!) based on several images taken in dark conditions. To limit the influence of any thermal noise component, several images need to be taken, preferably at various exposure or integration times. Basically, the same data or images as used in the case of measuring the average dark signal can be reused. So after averaging all images taken at a particular exposure time to reduce the thermal noise, calculations can take place on the averaged resulting image.
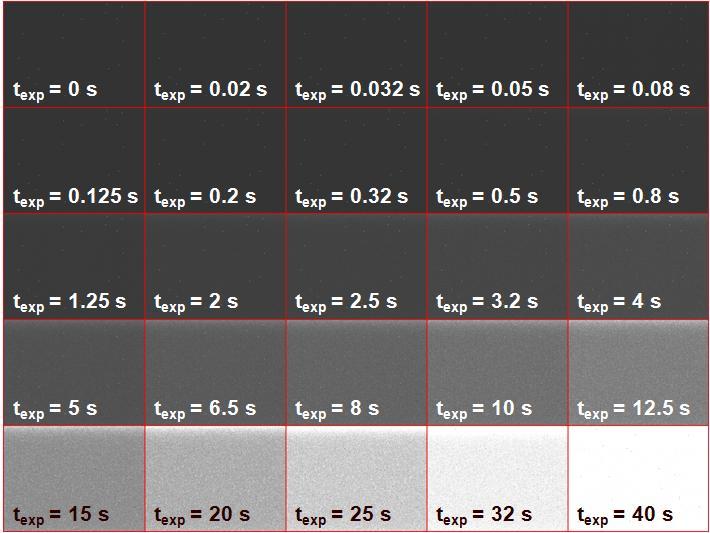
These averaged images are shown in Figure 1 : for 25 different exposure times, the result is visualized in the mosaic image. Corresponding exposure times are indicated.

Figure 1 : dark images as a function of the exposure time, taken at 30 deg.C.
As can be seen from Figure 1, the sensor saturates at longer exposure times. This is due to the limitation of the ADC in combination with the gain setting of the camera. These effects will be explained and measured later in another blog.
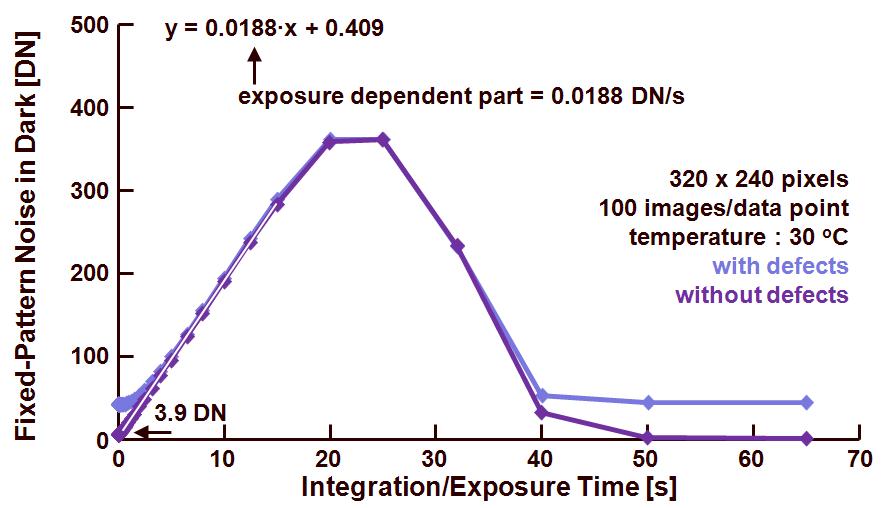
A first way of measuring/calculating the DSNU is to check its behavior as a function of exposure time. These result of this is shown in figure 2.

Figure 2 : fixed-pattern noise in dark as a function of the exposure time and at 30 deg.C.
[!!!! there is a typo on the figure !!! the exposure dependent part = 0.0188 DN/ms !!!]
There are two curves shown :
– the first one contains all data delivered by the sensor, including the defects (black and white defects). The latter ones hamper a linear behavior in the beginning of the curve. And they do not allow the FPN to go to zero for high exposure times
– the second one is based on the same data after the correction of dead pixels. This time the curve shows a better linearity as well as a fixed-pattern noise equal to zero for the highest exposure times. Notice that in the latter case the output signal of the sensor is saturated by the ADC, and no FPN can be detected.
The FPN for zero exposure time, or the exposure time independent part of the FPN is found to be equal to 3.9 DN. From the regression line calculated by means of the curve without defects, the time depending part of the FPN, being the dark current FPN, and equal to 0.019 DN/ms.
How to express the FPN of a sensor or a camera ? As could be learned, part of the FPN is depending on the exposure time (and temperature), another part is not. This makes the expression of the dark signal non-uniformity or DSNU not always uniform. For example in the case illustrated, and specified at an average signal level of 25 % of saturation and an exposure time of 8 s, the DSNU can be expressed as :
– Maximum value of dark signal = 2905 DN and minimum value of the dark signal = 1373 DN.
– Peak-to-peak value of 1532 DN.
– Root mean square (rms) value equal to 150.5 DN.
Without knowing the average value of the dark signal, all these numbers are meaningless. Because it is impossible to judge whether these values represent a large DSNU or not. For that reason, taking the average dark signal of 1637 DN into account, the DSNU can also be expressed as 57.0 % of the average signal at 25 % of saturation. This gives a much better judgement of the DSNU.
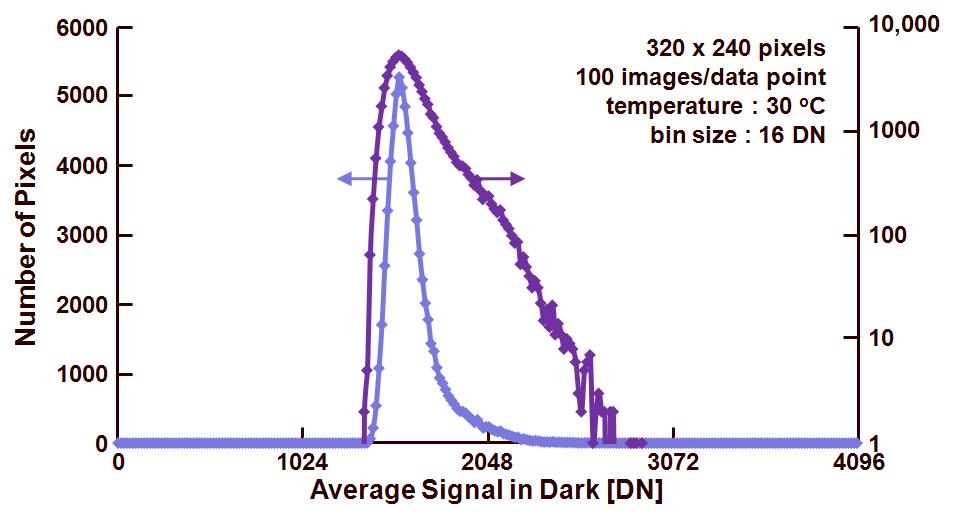
Notice that all these numbers represent the DSNU, but intrinsically they do not tell anything about the distribution of the dark fixed-pattern noise. The right answer to this issue is to show the histogram of the dark signal. Only in this way one can get a good idea about the randomness of the FPN in dark. This is illustrated in Figure 3.

Figure 3 : histogram of the average signal in dark, taken at 30 deg.C.
The same data is shown in the two curves, but one on a linear vertical axis, the other one on a logarithmic vertical axis. Notice that only in the latter case the outliers can be seen in the tail of the distribution ! Although not that many pixels have an outlier, they do show up immediately once the device is put into dark and they heavily contribute to the visual image quality. So a logarithmic scale on the vertical axis should be the preferred way of dealing with histograms of average dark sensor signals.
“There is a warning sign on the road ahead” :
– It is clear that the dark signal non-uniformities are depending on the exposure time, so accurately measuring or defining this parameter is very important,
– The average dark signal as well as the non-uniformities are exponentially depending on the temperature. As a consequence, the temperature of the device under test needs to be stabilized with an accuracy of 1 deg.C, a change of 1 deg.C in device temperature can result in 10 % deviation of the dark signal. Notice that the device temperature is not necessarily also room temperature or vice versa ! If the outcome of the average dark signal measurement is used for calibration purposes, the exact knowledge of the device temperature becomes of crucial importance,
– At this moment in the discussion, there is not yet any interest in the temporal noise behavior of the sensor or camera. To limit the influence of the temporal noise on the measurements it is recommended to take many images in dark and averaged them on pixel level. In this way the temporal noise will be averaged out,
– Fixed pattern noise can have several origins, it can come from the pixel, the row, the column, shading effects and saturation non-uniformities. The split of the overall FPN into these various components will be discussed next time.
Albert, 19-09-2011.
Dear Albert,
I have a question regarding the DSNU IT dependency.
According to your course that i followed 2-3 years ago, the DSNU is the interception of the slope of the log(spatial noise) vs log(signal-offset) with the x-axis and the FPNoffset the spatial noise at IT=0.
How the DSNU could then be IT dependent ?
regards,
ABM
Dear Albert,
Thank you very much for your blog, I learn more from it. But, I am confused about the Fig.2 in this blog. How it the formula y=0.0188x+0.409 got from the curve. Thank you very much!
best wishes!
pi
It is the forumula that goes together with the regression line through the data points.
Hi Albert,
indeed there is a mistake (as commented by pi) in the regression line in the Fig. 2. The factor is 1000. Probably you have made regression in the basis of miliseconds instead of seconds and that is why you have an error.
If you do not see it yet, let me explain:
From Fig.2 for x=10s you have almost 200 DN which gives about 20 DN/s for the multiplication factor instead of 0.0188 DN/s or use the correct units as DN/ms.
If you still maintain this blog, please correct the Fig.2 giving the correct value or units for ‘exposure dependent part’ which should read either 18.8 DN/s or 0.0188 DN/ms.
Dear Albert.
I am a student studying industrial cameras.
While reading the blog post, I have a question.
Where did the 2095DN and 1373DN values come from?
Through the formula, we confirmed that the value of 8s is 150.809.
This value is similar to the RMS of 150.5DN, and although it does not exactly match, it was determined that it was an error caused by the formula.
However, I don’t know how the values of 2095DN and 1373DN are calculated.
Additionally, I wonder how 57% was calculated…
Plz reply…
Thanks!
The numbers 2095 DN and 1373 DN come from the measurements, simply check the largest value and the lowest value.
Regards, Albert.
Hi Albert,
It is not clear how the 57% for DSNU came about. If the avg. dark signal is 1637 DN at 25% saturation, and the rms for the dark signal is 150.5 DN, shouldn’t it be 150.5/1637 ~ 9.2%.
Thanks
SN
Dear Satyah, I think you are right, this must be a typo. And your calculation seems to have the right result.
Sorry about this mistake.
Albert.