After discussing the anti-blooming measurement in vertical direction, this time the measurement of the anti-blooming in horizontal direction is described. But in principle it can be very short : exactly the same procedure is applied in the horizontal direction as explained in the previous blog.
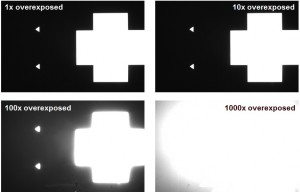
Figure 1 shows images captured at various levels of illumination (by changing the exposure time) : top left at the onset of saturation, top right at 10 times overexposure, bottom left at 100 times overexposure and bottom right at 1000 times overexposure.
Figure 1 : Images of the test target at different exposure levels.
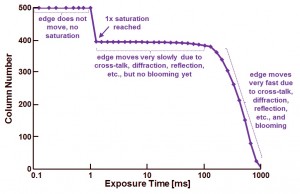
A simple software tool is developed to check for every exposure time, on which column the vertical black-white crossing is occurring in the images. If the pixels are not saturated yet, the software tool simply outputs column number “500”, which actually does not exist in the left half of the image. As soon as at a particular illumination level of the pixels in the white region reaches 75 % of saturation, the measurement tool outputs the column number at which the black-white transition occurs. If the overexposed area reaches the side of the image, the output of the measurement tool is equal to “0”. The result of this analysis is shown in Figure 2.
Figure 2 : Position of the black-white transition (indicated as column number) as a function of exposure time.
In Figure 2, from left to right, the following information is available :
- For small exposure times (< 1 ms), the white pixels are not yet saturated, this is indicated by the column value equal to “500”,
- For an exposure value of 1.28 ms, saturation occurs and the black-white transition is located at column number “394”,
- From this moment onwards the large white area starts growing slowly due to all kind of optical artefacts, listed already in previous blog,
- For exposure times larger than 120 ms, the area of the white spot grows very fast, as can be seen in the graph. This change in “speed” is due to the blooming artefact that apparently occurs at very high exposure levels.
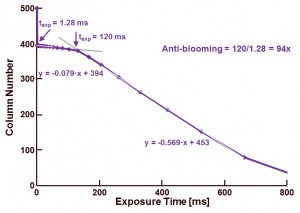
To calculate a number for the anti-blooming capabilities of the sensor, the same data as present in Figure 2 is shown again on a linear scale as illustrated in Figure 3.
Figure 3 : The same information as already illustrated in Figure 2 is shown again, but now on a linear scale.
The two important regions (saturated but no blooming and saturated with blooming) are approximated by means of a linear regression line, and as can be seen, below 120 ms exposure time, blooming plays no important role, but above 120 ms exposure time, blooming is dominating over all other artefacts. The exposure time of 120 ms seems to be a cross-over exposure time. (Of course this number of 120 ms is depending on the illumination level and has no further meaning.)
The anti-blooming capability is then defined as the ratio of the exposure time at which saturation is reached (texp = 1.28 ms) and the cross-over exposure time (texp = 120 ms), resulting in an anti-blooming capability of 94 times overexposure.
In conclusion : the anti-blooming capabilities in horizontal direction differ (a bit) from the capabilities in vertical direction. This can be explained by a different boundary definition (lay-out, technology, isolation), between neighbouring pixels in horizontal compared to vertical direction.
Albert, 21-09-2015.


Hi Albert,
What is the effective way of measuring the Anti-Blooming for bayer-RGB sensors ?
Hi, anti-blooming measurement for a colour device or for a monochrome one is exactly the same. The only difference is the variation in sentivity between the various pixels. But this will not change the blooming capabilities of the sensor. Moreover, the measurement I showed you recently is a RELATIVE measurement, so the sensitivity drop from a monochrome to a colour sensor are automatically included. Success ! Albert.
Thanks Albert.
Thanks for this Article. It’s great to read the Scientific Explanation and see the Math involved.
I made a Video to demonstrate an Anamorphic Lens that I built. In order to show the characteristics of the Lens under strong light I pointed the Camera directly into the Sun. Needless to say blooming occurred.
I saw one effect that I thought interesting, that different pixels had slightly different buckets with slightly differing fill / spill capabilities.
Note in the Video (Website URL above) at 11:30 (assuming your Monitor has it’s Brightness and Contrast set to show a wide Dynamic Range, and offer ‘fairly black’ Black Pixels) how the Wells fill and spill at slightly different rates; notice what could only be described as a ‘Solar Flare’ where an arm stretches out at the 4 o’clock position.
Technical Note: Filmed on an HTC One (M7) Cellphone with two Prisms held in front of the Lens to anamorphize the Image.
I gave an URL that starts at the beginning of the song which is a few seconds before the time I referred to above, thinking you might not wish to sit through the whole Video.
The Demo is a 6 min. loop, with different songs timed to coincide with events in the Video. You might enjoy THIS 30 second section, especially the pulsing of the blooming. If you watch a couple of minutes you can count the Lens Elements and see how few there are (and that the Prisms add very few artifacts, and relatively little flaring).
Hope you enjoy the use (abuse ?) of blooming as much as I enjoyed your Article. IF the music is agreeable to your ears all the better (otherwise there is a Mute Button and you can simply watch).
YT,
Rob