From the two foregoing discussions on the full well capacity, it could be learned that :
– In the case the full well is determined/limited by the ADC, comparable results for the FWC can be obtained by means of linearity measurements as well as from the mean-variance method,
– In the case the full well is not determined/limited by the ADC, the results obtained from the linearity measurements show larger full well values than the ones obtained from the mean-variance method.
To explain the discrepancy between the FWC data of the latter case, one should realize that when the average output signal turns into saturation, a few non-uniformity issues are simultaneously popping up :
– PRNU or photo-response non-uniformities : the pixels with the highest sensitivity can reach saturation first,
– Non-uniformities in saturation level, some pixels will saturate at a lower FWC than others,
– It is not clear from the measurements which part of the pixel is causing the saturation : the pinned-photodiode, the floating diffusion capacitance, the output swing limitation of the source-follower, output limitation swing of the analog circuitry. Moreover, all these limitations can interfere with each other, which makes the situation even more complex to understand and explain.
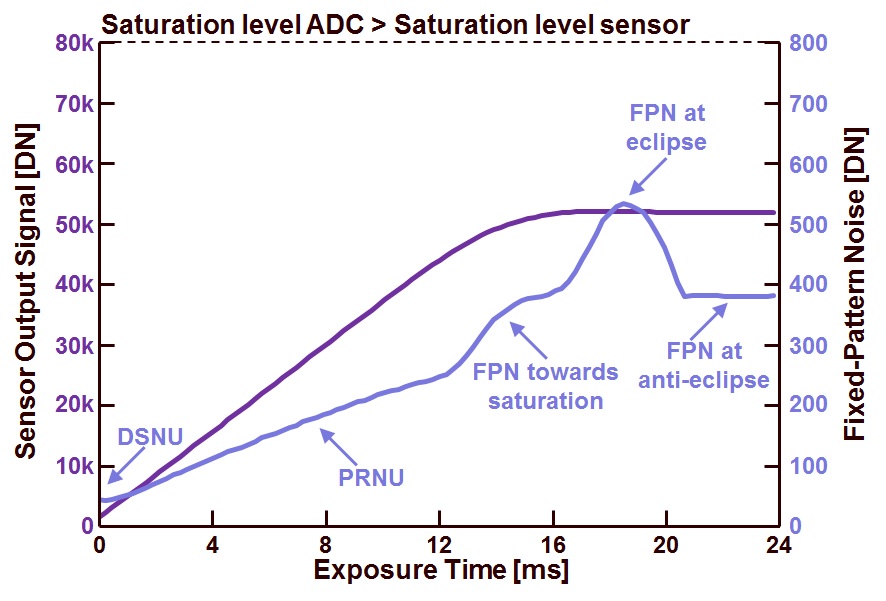
To find out what is going on, the fixed-pattern noise is measured, and some interesting results were obtained. The analog gain is put to a low value, and the reference voltage of the ADC is set to a higher voltage (the reference voltage is defining the analog input voltage that corresponds to an output of all “1”s). In this way the ADC is not limiting the output swing, neither defining the FWC.
The measurement results are shown in the figure 1 : the left axis indicates the average output signal of 100 x 100 pixels as a function of the integration/exposure time; the right axis shows the fixed-pattern noise obtained from these 100 x 100 pixels, also as a function of the exposure time.
Figure 1 : Average sensor output and fixed pattern noise as a function of exposure time for a window of 100 x 100 pixels.
Some interesting details can be revealed from the FPN data :
– For very low values of the signal (exposure time < 1 ms), the FPN shows a kind of plateau, indicating the FPN in dark,
– For moderate values of the signal (1 ms < exposure time <12 ms), the FPN linearly increases, determined to the PRNU, the latter is proportional to the average signal value,
– For higher values of the signal, in the region where the output signal tends to saturate (12 ms < exposure time < 16 ms), the FPN grows faster and tends to saturate as well. Most probably this is the effect of the pixels that saturate. The FPN at saturation is larger than the PRNU and for that reason the FPN increases. The FPN tends to saturate, because once all pixels are saturated, the FPN does no longer change,
– For saturated values of the signal (16 ms < exposure time < 20 ms) the FPN gets a second boost. It is not completely clear what is happening here (the camera and sensor are “unknown”), but most likely the double sampling of the reference and useful signal start showing some “black sun” or “eclipse” effects. This results in a larger FPN,
– For the largest exposure times (exposure time > 16 ms), all pixels are running in the “black sun” or “eclipse” mode, but apparently the sensor is provided with an anti-eclipse circuit which pins the column voltages to a fixed voltages.
The abovementioned explanation is based on a close observation of what the behavior of the output signal. This is illustrated in Figure 2, showing the same results as the ones mentioned in Figure 1, but with an adapted scale on the vertical axis.
Figure 2 : Same data as shown in Figure 1, but with an adapted scale on the left vertical axis.
As can be noticed, the average output signal tends to reach saturation for an exposure time of (about) 17 ms, but then the average output signal decreases again for a longer exposure time. From 20 ms onwards, the average output signal seems to be clipped to a particular value, so does the FPN. A simple explanation for this effect can be the presence of an anti-eclipse circuit.
Anyone else has a better explanation ?
Albert, 06-12-2013.


Though it might not be the case for this measurement(camera), blooming could be a possible source of FPN increase after saturation.