Several blogs are spent on the measurement of fixed-pattern noise in dark. How far are we now, which parameters are on the table ? As a kind of wrap-up, the following was measured and reported for the dark current (obtained at room temperature) :
– Offset of the signal in dark : 819 DN,
– Average dark signal : 0.1025 DN/ms,
– Dark signal at 25 % of saturation or at 8 s integration time : 1637 DN, after offset correction : 818 DN,
– Number of ADC-bits : 12,
– Head room for the video signal : (212 -1) DN – 819 DN = 3276 DN.
And for the FPN in dark the following values were found (all numbers obtained at room temperature and after correction of defect pixels) :
– Total FPN :
o FPN part independent of the exposure time, being equal to 3.9 DN,
o time depending part of the FPN, being the dark current FPN or DSNU, and equal to 0.0186 DN/ms. At an average signal level of 25 % of saturation and/or an exposure time of 8 s, the DSNU can be expressed as :
§ maximum value of dark signal : 2905 DN, or after offset correction : 2086 DN, and,
§ minimum of the dark signal = 1373 DN, or after offset correction : 554 DN,
§ peak-to-peak value of 1532 DN,
§ root mean square (rms) value equal to 150.5 DN,
§ the rms value of the DSNU can also be expressed as 18.4 % of the average signal at 25 % of saturation,
§ or is equal to 4.6 % of the saturation level of the sensor,
§ the DSNU has a median value of 1600 DN, after correction of the offset equal to 781 DN,
– Column FPN :
o 2.9 DN is the FPN at 0 s exposure time,
o the time depending part of the column FPN equals to 0.0008 DN/ms. At an exposure time of 8 s or at 25 % of saturation level, the column FPN :
§ equals to 7.8 DN rms or,
§ taking into account the absolute values mentioned earlier, the column FPN can be calculated to be equal to 0.95 % at 25 % of saturation, or 0.24 % of the saturation level of the sensor.
– Row FPN :
o 2.4 DN is the FPN at 0 s exposure time,
o the time depending part of the row FPN equals to 0.0116 DN/ms. At an exposure time of 8 s or at 25 % of saturation level, the row FPN :
§ equals to 92.8 DN rms or,
§ taking into account the absolute values mentioned earlier, the column FPN can be calculated to be equal to 11.4 % at 25 % of saturation, or 2.84 % of the saturation level of the sensor.
– Dark shading or low-frequency dark signal variation :
o the peak to peak value equals to 561 DN,
o a maximum value of 2116 DN, or 1297 DN after correction of the offset, and,
o a minimum value of 1555 DN, or 736 DN after correction of the offset.
Taking the FPN numbers at 0 s integration time into account, one can state that 2.9 DN is coming from the column FPN, 2.4 DN is coming from the row FPN. To complete a total FPN of 3.9 DN, the pixels themselves contribute 1.0 DN. In other words, the FPN measured on pixel level is mainly coming from the column and row circuitry.
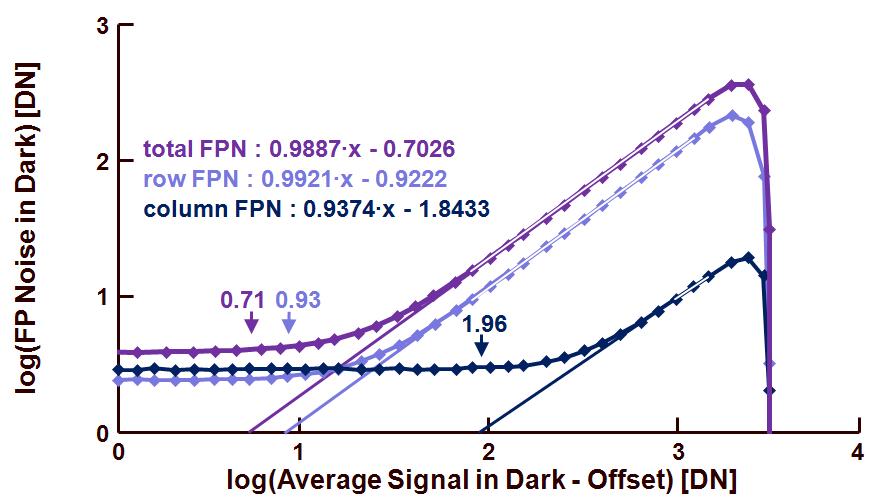
To conclude this chapter about FPN in dark, the obtained results are summarized in figure 1, showing the fixed-pattern noise as a function of the average effective dark signal (= corrected for the offset).

Figure 1 : Overview of the results obtained from the fixed-pattern noise measurements.
Shown are the total FPN, the column FPN and the row FPN. At the crossing of every curve with the vertical axis, the FPN at an integration time equal to 0 s can be found :
– total FPN : 100.593 DN = 3.92 DN,
– column FPN : 100.464 DN = 2.91 DN,
– row FPN : 100.385 DN = 2.42 DN.
At the crossing of the extrapolated curve (with slope = 1), and the horizontal axis, the DSNU can be found :
– total DSNU : 10-0.71 = 0.195 = 19.5 % (18.4 %),
– column DSNU : 10-1.96 = 0.011 = 1.1 % (0.95 %),
– row DSNU : 10-0.93 = 0.117 = 12 % (11.7 %).
The numbers between brackets are the ones obtained through straight-forward calculation shown at the top of this blog. They illustrate the accuracy of the curves shown in figure 1.
In principle there is one FPN of interest still missing, being the FPN at saturation. This will be discussed at the moment the non-uniformity with light will be studied.
PS Some numbers mentioned in this blog deviate from previous blogs, due to corrections. Sorry about that.
Albert, 15-12-2011.
Excellent article. Thanks for the writeup.
The DSNU varies linearly with exposure time and exponentially with temperature. Hence the calculation of DSNU should be done at a stabilized temperature and it should be heated to the temperature at which the sensor chip stabilizes in the actual product.
In our case we place the imaging system in a temperature controlled device and measure the DSNU variation with temperature.