Another interesting parameter to investigate is the amount of photons that are falling on a pixel ? So in this blog we will vary the amount of light, expressed in the number of photons, coming to the sensor. In a practical situation this simply means that the incoming light power needs to be measured and next, the amount of photons needs to be calculated (knowing the wavelength of the incoming light). Based on the synthetically generated images, the FPN and the temporal analysis is performed, in the same way as also done earlier in previous blogs.
For this experiment, the amount of photons was changed in multiple steps from 0 to 6.5 Mphotons. In this way a varying light input can be generated. Actually this is already being done in an earlier blog by changing the exposure time of the sensor. It can be expected that the results are very similar to the ones obtained when working with different light inputs through changing the exposure time, but here we can get something extra. The results are shown in 4 figures :
Figure 1 showing the average signal and the light fixed-pattern noise as a function of the amount of incoming photons. As can be expected the average signal as well as its FPN component increase as a function of the number of photons. In this particular example, the exposure time is fixed to 100 ms, making sure that the pixels easily saturate at the higher photon flux values.
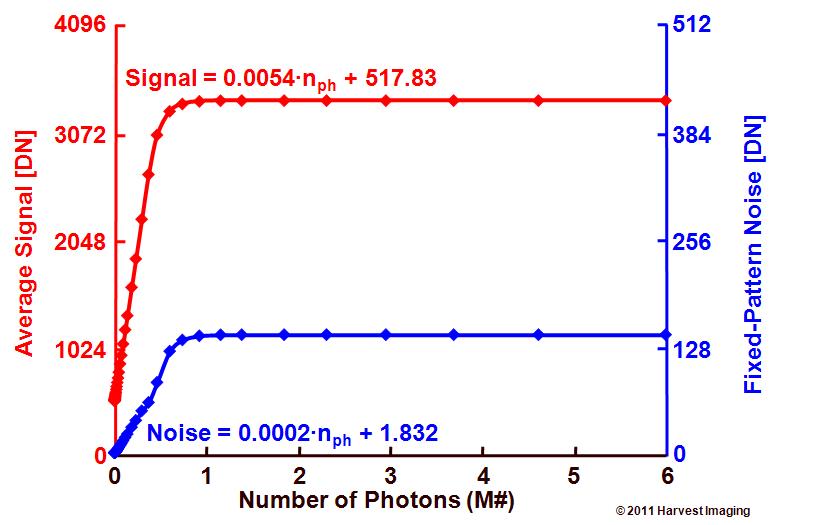
Figure 1 : average signal and light fixed-pattern noise as a function of the amount of incoming photons.
As can be expected, in the non-saturated situation, the output signal is proportional to the amount of incoming light. Shown in Figure 1 is the relation between the output signal and the number of photons, as well as the FPN as a function of the number of photons. The ratio between the two formulas reveals the FPN in light, or the PRNU, being equal to : 0.0002/0.054 = 0.037 or 3.7 %.
Figure 2 showing the light fixed-pattern noise as a function of the average effective output signal.
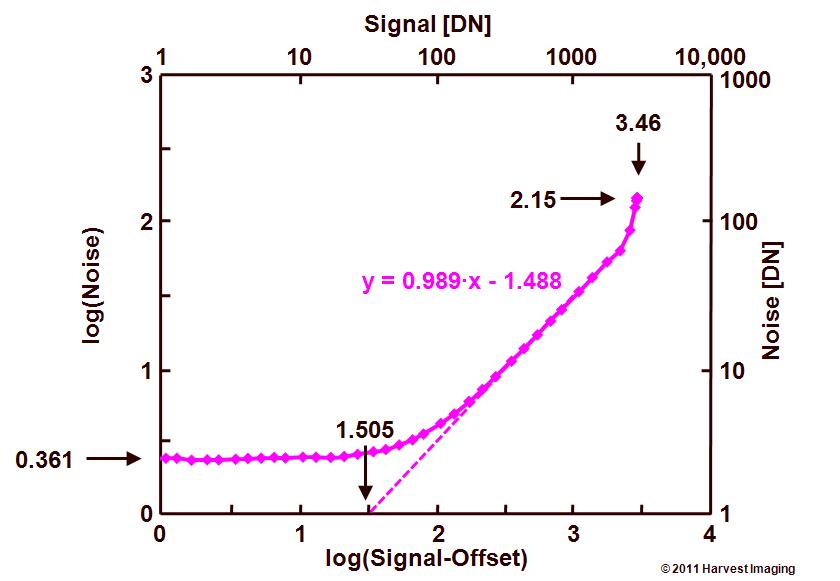
Figure 2 : light fixed-pattern noise or PRNU as a function of the average effective output signal.
From this figure the following parameters can be extracted :
– FPN on pixel level being equal to 100.361 DN = 2.30 DN,
– The saturation level being equal to 103.46 DN = 2884 DN,
– The PRNU level being equal to 10-1.505 = 0.031 or 3.1 %.
Figure 3 showing the average signal and its temporal noise component as a function of the light input.
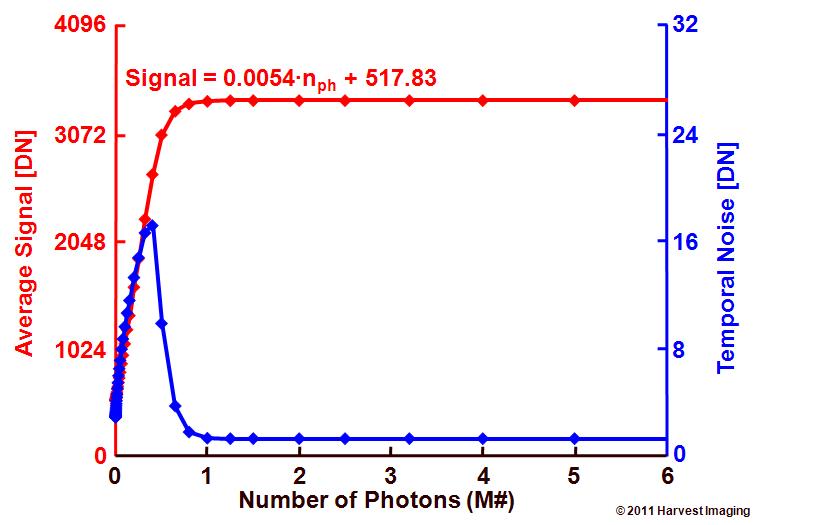
Figure 3 : average signal and temporal noise as a function of the light input.
The average output signal curve is the same as the one in Figure 1, but the noise shown is now the temporal noise, basically composed out of photon shot noise as long as the pixel is not saturated.
Figure 4 showing the temporal noise as a function of the average signal.
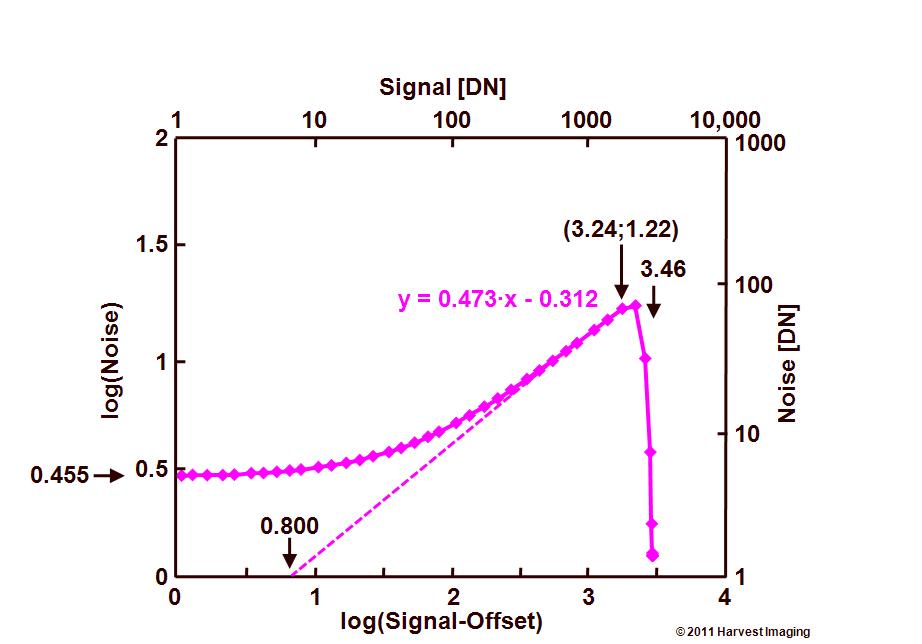
Figure 4 : temporal noise as a function of the average effective output signal, or the Photon-Transfer Curve.
This last figure is showing the real and original photon-transfer curve. From the graph the following details can be deduced :
– Noise floor in dark being equal to 100.455 DN = 2.85 DN,
– Onset of anti-blooming at 103.24 DN = 1738 DN,
– Saturation level being equal to 103.46 DN = 2884 DN,
– Conversion gain, being equal to 10-0.800 = 0.158 DN/e–.
As can be learned from this short exercise, the amount of incoming photons can be a parameter of interest to change the input signal to the sensor and to generate the data needed to reconstruct the PTC curve. It should be noted that there is no need to know the exact amount of photons to construct figures 2 and 4. So the variation in photons can be realized by whatever means you have available. But in the case that the exact amount of photons can be measured, it is worthwhile to create the PTC with the number of incoming photons on the horizontal axis instead of the effective output signal. This curve is shown in Figure 5.
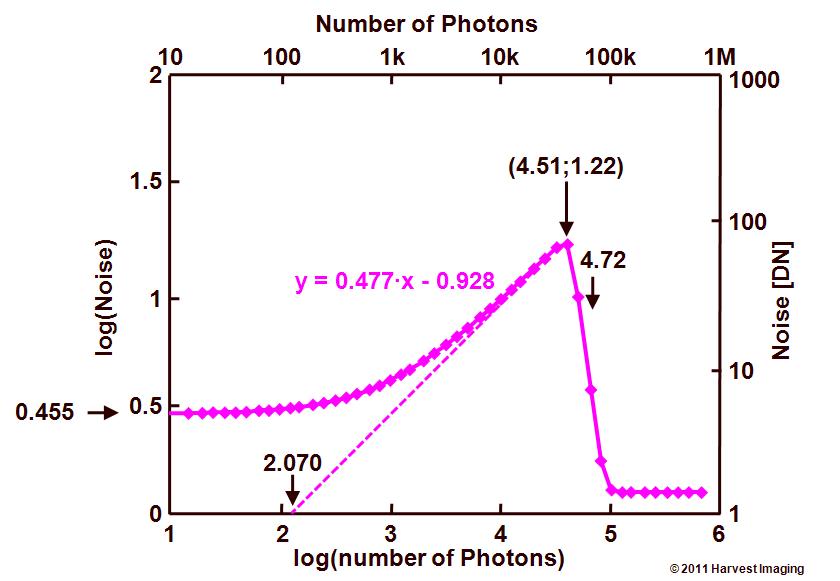
Figure 5 : temporal noise as a function of the amount of incoming photons.
Going back to the formulas derived to generate the PTC, the effective output signal can be written as :
Stot = k·No = k·h·Nph
with :
– Stot : the effective output signal (corrected for the offset),
– k : conversion gain,
– No : number of electrons generated in the pixel,
– h : quantum efficiency of the pixel,
– Nph : number of photons impinging the pixel.
The noise can be written as :
stot = k·stemp = k·(sr2 + so2)0.5 = k·(sr2 + h·Nph)0.5
with :
– stot : total noise measured at the output of the sensor,
– stemp : temporal noise on pixel level,
– sr : noise floor of the electronic circuitry,
– so : photon shot noise.
In the case the noise floor of the electronic circuitry is the dominant noise source, the total measured noise simply equals to :
stot = k·stemp = k·sr
but when the system is shot-noise limited, the noise equals to :
stot = k·(h·Nph)0.5
or for stot = 1, one finds :
h = 1/(k2·Nph)
which adds to the PTC the option to calculate and measure the quantum efficiency. Unfortunately in this situation the PTC looses one of its most attractive features : it is no longer a relative measurement, absolute measurements of the light input is mandatory.
In the case of Figure 5, the quantum efficiency can be found as :
h = 1/(0.16·0.16·102.07) = 0.332 = 33.2 %.
Good luck with your own experiments.
Albert, 07-02-2011.
Thanks for the clear explanation.
Now i understand why the PTC shift in the EUV range where the Quantum yield is taking into account with the QE.
regards,
Ali
Hi Albert :
Sorry for last post which wavelength can’t show.
re-post :
I had a question about QE. Base on the equation of Responsivity R=QE*wavelength/1.24
I can get QE=R*1.24/wavelength
Does the QE from Responsivity is the same to the QE from PTC ?
regards,
Ataru
Hi, QE is QE, should be independent of the way you measure or obtain it.
Success, Albert.