 It was surprising to see the amount of reactions on the previous “Playing Time” blog. Thanks for all the remarks, questions, suggestions, also through the www.image-sensors-world.blogspot.com web-site.
Remember what the issue was : measurements were done with a constant LED light input at two different settings :
– gain = 1, exposure time = 42.24 ms, 100 images, and,
– gain = 4, exposure time = 10.56 ms, 100 images.
A constant switch between the two settings was realized, and in total 21 (times 100 images) measurements were done to check the reproducibility. Based on the numbers shown, one would expect the same output in all situations.
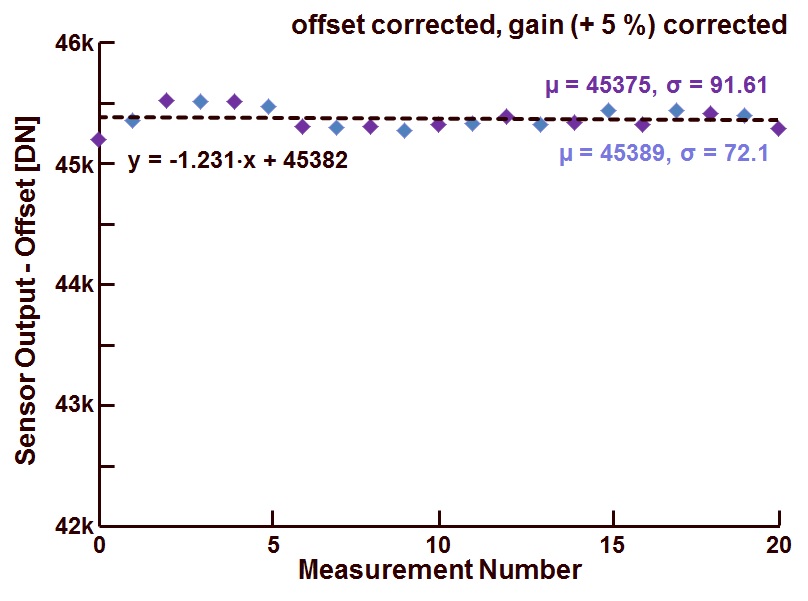
A first issue, being the offset that does not scale with the gain, was corrected by subtracting the (measured seperately) offset for all measurements. A second issue, being the incorrect ratio of gain setting (theory 1:4, reality 1:3.8) was corrected, and then the final result is shown in Figure 1.
Figure 1 : Sensor output values (corrected for the offset and corrected for incorrect gain setting) as a function of measurement number (each dot represents the average value of a 50×50 ROI of 100 images).
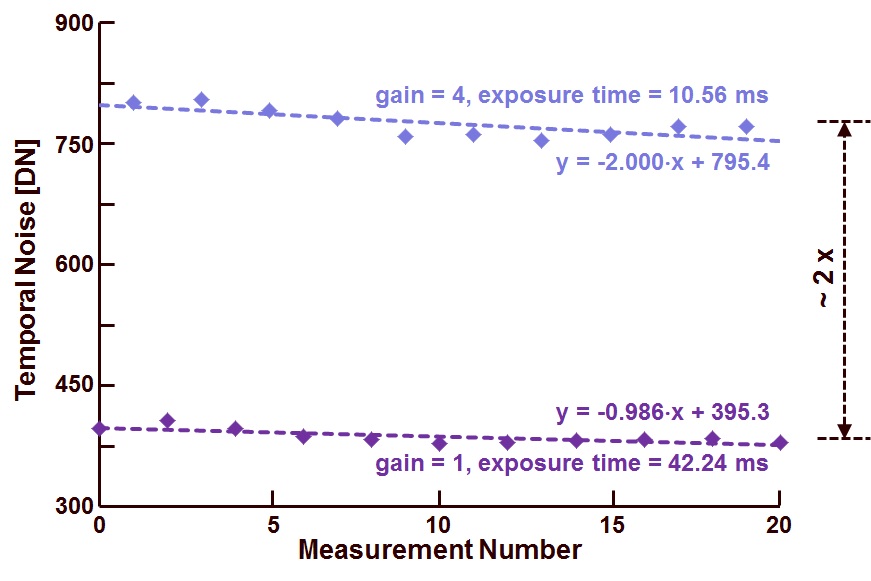
To find the root cause of the fluctuations fo the output signal, the temporal noise on pixel level is calculated, this excludes the FPN of the pixels. The result of the measurement is shown in Figure 2.
Figure 2 : Noise calculations of the measurements performed in Figure 1 (each dot represents the average value noise value of a 50×50 ROI of 100 images).
Notice that, although the output signal in both cases is expected to be the same, that is not the case for the noise ! The temporal noise is dominated by photon shot noise and if the cases of “gain = 1” are set as the references, then the photon shot noise (expressed in electrons) for the cases of “gain = 4” is a factor of 2 less in the charge domain (4 times less photons). But with a gain setting that is 4 times higher, the temporal noise in the digital domain becomes a factor of 4 higher. Compared to the cases of “gain = 1”, the noise in the digital domain of the cases of “gain = 4” will be factor of 2 higher. This is pretty much the case for the measurements (proving that the measurements and calculations were done right).
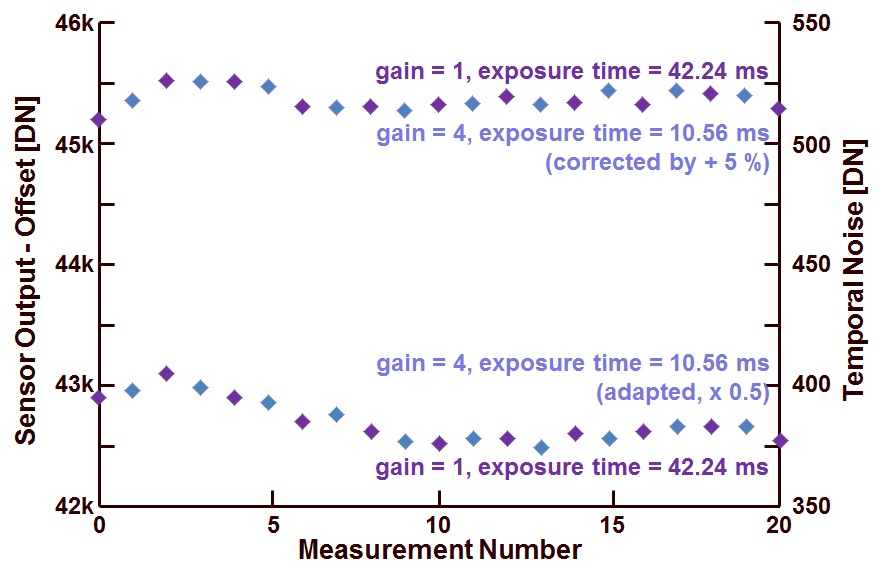
If the noise of the “gain = 4” cases is reduced by a factor of 2, and if then the noise results are plotted together with the output signals of the sensor, Figure 3 is generated.
Figure 3 : Measured output signal (corrected where needed) and calculated temporal noise (adapted where needed) of the measurements performed.
With a bit of imagination, a similar pattern that was present in the measurements of the output signal can be found in the calculated temporal noise. There is enough correlation between both to conclude that the changes in the output signal was coming from the light source, because the fluctiations are reflected in the (photon) shot noise results as well. (After some experiments, it was found that the power supply for the LEDs was causing the issues, because its output voltage was not stable over time.)
This exercise illustrates the power of using noise measurements as a diagnostic tool !
Albert, 06-09-2013.


So my second guess was ~ right. Do I get the bottle? 😉